Quantcast
Channel: AmiBroker Knowledge Base
Viewing all 115 articles
Browse latest View live

Setting default color for studies

$
0
0

In order to select color before drawing the trendline or other studies it is enough to choose the color in Color Pick (Select color) toolbar button located in the Format toolbar.

Color Pick

This allows to avoid drawing the line and changing color later on in line Properties dialog.


How to add full name to the Price chart title

$
0
0

The full name of the security can be retrieved in AFL using FullName() function.

In order to add such information to the built-in Price chart, we need to do the following:

  1. Click on the chart with right mouse button
  2. Choose Edit Formula from the context menu
  3. Modify the Title definition line, the built-in code contains:
    _N(Title StrFormat("{{NAME}} - {{INTERVAL}} {{DATE}} Open %g, Hi %g, Lo %g, Close %g (%.1f%%)", 
                         OHLCSelectedValueROCC) ) ));

    We need to change it into:

    _N(Title StrFormat("{{NAME}} - " + 
                          FullName() + 
                          " - {{INTERVAL}} {{DATE}} " +
                          "Open %g, Hi %g, Lo %g, Close %g (%.1f%%) Vol %.0f", 
                          OHLCSelectedValueROCC) ), ) );
  4. To apply these changes choose Tools->Apply Indicator from the menu.

If we have Full name information imported into the database and visible in Symbol->Information window, the updated chart title will show it next to the ticker name.

Fullname in the chart title

How to copy backtest trade list to a spreadsheet

$
0
0

There are several ways to transfer the backtest results to a spreadsheet.

  1. Immediately after the test we can just click on the results list with right mouse button and choose Copy from the menu. It is also possible to click on the results and use Ctrl+C key shortcut.

    Copy Trade List

    The operation will copy the entire list, so there is no need to select all rows manually.

  2. After the test, we can also use File->Export option from the main program menu to export the results list to a CSV or HTML file, which could be opened from Excel later on.

    Export Trade List

  3. Backtest results are also accessible through the Report Explorer:

    Backtest Report Explorer

    In order to open detailed report for the particular test it is enough to double-click on the selected line. Then, after we navigate to Trade List page, to copy the results, the best option to use is Edit->Copy Table

    Copy Table

    Unlike the regular Copy option, Copy Table transforms HTML tables into CSV format and copies it into clipboard so tables can be pasted easily to Excel. Also it divides Entry/Exit columns into separate Entry/exit date/price columns.

Drawing indicators on a subset of visible bars

$
0
0

By default, the Plot function draws the graph for all visible bars. In some situations however, we may want to draw some selected bars, leaving remaining chart space unaffected.

To achieve that – we simply assign Null value for the bars that we want to skip. Our graph will just be drawn for the non-null bars.

This simple example draws candlesticks only on Mondays and leaves empty all the other days.

IsMonday DayOfWeek() == 1;
// assign Close for Mondays, otherwise assign Null
Data IIfIsMondayCloseNull ); 
// plot the data
PlotData"Chart of Mondays"colorDefaultstyleCandle );

The following example shows how to restrict the visibility to last N bars. The code defines a custom function, which can be called later on for the arrays we want to show only partially.

// custom function definition
function LastNBars( array, bars )
{
    bi BarIndex();
    lvbi LastValuebi );

    // use Null value for bars other than last N
    return IIfbi lvbi bars, array, Null );
}

// price plot
PlotClose"Close"colorDefaultstyleBar );
 
// MA-50 restricted to last 10-bars only
line MAClose50 );
PlotLastNBarsline10 ), "last 10 bars"colorRed );
 
// shaded area
PlotLastNbarsTrue10 ), ""colorYellowstyleArea|styleOwnScale|styleNoLabel010, -);

Draw chart only for last N bars

In the above chart both Moving average (red line) and yellow shading area have been restricted to last 10-bars only.

In a similar way we can restrict the visibility to most recent day only in intraday chart:

// custom function definition
function ShowLastDay( array )
{
    dn datenum();
    lastDay dn == LastValuedn );

    return IIflastDay, array, Null );
}

// price plot
PlotClose"Close"colorDefaultstyleBar );

// daily high / low on last day only
dailyH TimeFrameGetPrice("H"inDaily );
dailyL TimeFrameGetPrice("L"inDaily );
PlotShowLastDaydailyH ), "dailyH"colorGreenstyleThick  );
PlotShowLastDaydailyL ), "dailyL"colorRedstyleThick  );

// shaded area
colorPaleYellow ColorBlend(colorWhitecolorYellow0.1);
style styleArea styleOwnScale styleNoLabel;
PlotShowLastDay), ""colorPaleYellowstyle010, -);

Draw chart only for last day

Other practical implementations of such technique is presented in these formulas:
http://www.amibroker.com/kb/2007/03/24/how-to-plot-a-trailing-stop-in-the-price-chart/
http://www.amibroker.com/kb/2014/10/10/how-to-draw-regression-channel-programatically/

Using optimum parameter values in backtesting

$
0
0

After Optimization process has found optimum values for parameters of our trading system, typically we want to use optimum values in subsequent backtesting or explorations. In order to achieve that, we need to manually update default_val (second) argument of Optimize function with the values obtained from the optimization report.

The arguments of Optimize function are shown below (note second parameter marked in dark red color – this is the default value parameter we will be changing after optimization run):

some_var = Optimize( "description", default_val, min_val , max_val, step );

Let us consider the following example formula used for optimization process:

SetOption("ExtraColumnsLocation"1);
periods Optimize"Periods"2550); // note that default value is 2
Level Optimize"Level"22150); // note that default value is 2

Buy CrossCCIperiods ), -Level );
Sell CrossLevelCCIperiods ) );

If we perform Optimization process and check the results (for this example we use Net Profit as the optimization target), we can see that the best results use Periods = 6 and Level = 126.

Optimization result

Now in order to run backtest and obtain exactly the same results as in the respective line of the above Optimization results, we need to enter the values into default argument, so the modified code will look like this:

SetOption("ExtraColumnsLocation"1);
periods Optimize"Periods"6550); // we changed default value to 6
Level Optimize"Level"1262150); // we changed default value to 126

Buy CrossCCIperiods ), -Level );
Sell CrossLevelCCIperiods ) );

Now we can use the code with modes other than Optimization and the formula will use optimized values we retrieved from the results.

FastTrack data configuration and troubleshooting

$
0
0

General configuration process for FastTrack datasource is explained in the manual:
http://www.amibroker.com/guide/h_extsources.html

Sometimes however, after the configuration process the FastTrack data source is still missing from the list of sources in File->Database Settings. If that happens, please follow the steps listed below to make this source available:

First you need to make sure that you are using 32-bit version of AmiBroker as FastTrack is 32-bit application and only the other 32-bit application can use its data via their API. To check what version of AmiBroker you have go to Help->About window. If you do not have proper version, please download 32-bit one from http://www.amibroker.com/download.html

Secondly you need to install FastTrack for the Web (FT4Web) program. If you are using Windows Vista, Windows 7 or Windows 8, it is good idea to first turn OFF User Access Control (down to “Never notify”). The following video shows the process:
http://windows.microsoft.com/en-US/windows7/Turn-User-Account-Control-on-or-off. Then install FastTrack for the web (FT4Web) program.

If the FastTrack datasource is still missing from the data source combo in Database Settings, then it is necessary to check if:

  1. FT.DLL is inside “AmiBroker/Plugins” folder
  2. FastTrack.DLL file is installed by FT4Web inside Windows folder

If it can not be found in the Windows folder, we need to make sure that FastTrack for the web is installed, then perform a search for FastTrack.DLL file using Windows Explorer file search.

Once the FastTrack.DLL file is found, we need to copy it to AmiBroker main folder – then FastTrack datasource should then become available in AmiBroker.

How to display interest gains in the backtest report

$
0
0

The default backtest report shows total Net Profit figure, which includes both trading profits and interest earnings. With Custom Backtest procedure we can easily isolate these components by summing up profits and loses from individual trades, then subtracting trading gains from the Net Profit and report them as separate metrics.

SetCustomBacktestProc"" );

if ( Status"action" ) == actionPortfolio )
{
    bo GetBacktesterObject();
    bo.Backtest(); // run default backtest procedure

    // read Net Profit, Winners and Losers profits from the report
    st bo.GetPerformanceStats);
    netProfit st.GetValue"NetProfit" );
    tradeProfits st.GetValue("WinnersTotalProfit") + st.GetValue("LosersTotalLoss");

    bo.AddCustomMetric"Trading profits"tradeProfits ); 
    bo.AddCustomMetric"Interest earnings"netProfit tradeProfits );

}

// trading rules here
Buy CrossMACD(), Signal() );
Sell CrossSignal(), MACD() );

After backtest is run, we can see our custom metrics in the backtest report.

More information about creating custom metrics can be found in the manual:
http://www.amibroker.com/guide/a_custommetrics.html

Timestamps explained

$
0
0

When AmiBroker is fed with the data, say 1-minute data, it can create all other time intervals by compressing source data on-the-fly. So if you display say 13-minute chart, AmiBroker takes source 1-minute data and builds 13-minute blocks of data to create 13-minute bars. For this process to work correctly, source data need to have timestamps that point to the START of each bar interval. So with 1-minute data, the bar that has a timestamp 9:30:00 is supposed to cover trades from the period of 9:30:00.000 upto 9:30:59.999. All our data plugins provide data in that format.

Now, provided that we have say 1-minute data, AmiBroker can compress data to any other N-minute interval. When doing so, it can assign timestamps to compressed bars in different ways. This can be controlled through Tools->Preferences->Intraday dialog.

Timestamps

Let us check it on an example of a 5-minute bar based on input 1-minute quotes for e-mini contract.

Timestamps

As explained in the manual (http://www.amibroker.com/guide/w_preferences.html) – there are four choices available:

  1. Time of FIRST tick inside bar – when selected the bar gets the time stamp of the very first trade inside given time slot (bar). With this choice the bar will be stamped with 9:30:00 because this is the first tick (quote) available within that 5-min period
  2. Time of the LAST tick inside bar – when selected the bar gets the time stamp of the very last trade inside given time slot (bar). In this case the bar will be stamped with 9:34:00 because this is the last quote available within that 5-min period
  3. START time of the interval – when selected the bar is time-stamped with start time of the time slot (bar). The bar will be stamped with 9:30:00 because that is a beginning of the selected time period.
    NOTE: This is recommended and the default setting as it provides consistency with how source bars are timestamped. It should not be changed unless you have really good reason to do so.
  4. END time of the interval – when selected the bar is time-stamped with start time of the time slot (bar). The bar will be stamped with 9:34:59 timestamp, because that’s the very end of this 5-min period.

There is also an additional setting available (Override: Weekly/monthly bars use day of last trade), which allow to modify the behaviour in case of Weekly/Monhtly bars, no matter what is the main setting we use. This allows us to e.g. use START time of interval to identify intraday quotes, however – on a weekly chart display e.g. Wednesday date (if that is most recent day in current week) or Friday date for complete weeks.

We need to remember that the timestamps identify the whole bar and all trades within that bar, so if we use START time of interval for time-stamping, in the backtest use Close array for as BuyPrice and 5-minute periodicity, then in our report we will see:

Timestamps

So, we see the time 9:30:00, but this bar refers to trading activity from period 9:30:00-9:34:59 and the actual price is read from the tick being the Close of the whole 5-minute period (at 9:34:00 in the table above).

For the same reason – when we use weekly data for backtesting, we trade at Open, but for time-stamps we use Override box (so weekly bars are stamped with the data of the last day within given week) – then in the report we will see e.g. Friday dates because of the fact that we use such approach to time-stamp bars. This does not really mean that trade happened on Friday, but only that we use Friday date to identify the whole Monday-to-Friday week.


Running OLE automation scripts with 32- and 64-bit versions of AmiBroker

$
0
0

Automation scripts written in JScript or VBScript are supposed to be run from Windows Explorer to control AmiBroker from outside and run certain predefined tasks specified in the script. The recommended documentation explaining the automation interface and AmiBroker object model is presented here:
http://www.amibroker.com/guide/objects.html
http://www.amibroker.com/newsletter/01-2000.html

In case of any problems with execution of automation scripts, the very first thing to check is the .js (JScript) or .vbs (VBScript) file association within the Windows Control Panel. This determines which program in Windows executes the files with .js extension. By default that should be Windows Scripting Host, which is the default scripting engine integrated into Windows.

The following Microsoft help resources show how to change the file associations:
http://windows.microsoft.com/en-us/windows/change-default-programs#1TC=windows-7
http://windows.microsoft.com/en-us/windows-8/choose-programs-windows-uses-default

The other thing to remember is the fact that in 64-bit Windows there are actually two JavaScript engines, 32- and 64-bit. The location of those programs are:

32-bit
C:\Windows\SysWOW64\CScript.exe

64-bit
C:\Windows\System32\CScript.exe

If only one AmiBroker version installed, Windows would launch this installed version regardless of which scripting engine was used.

Things look differently if you installed both 32-bit and 64-bit versions of AmiBroker on the very same machine. In this case 32-bit scripting engine would open 32-bit AmiBroker while 64-bit scripting engine would open 64-bit AmiBroker.Therefore, if we want to specifically launch 32-bit AmiBroker, then pointing at the particular engine by using command line may be required:

C:\Windows\SysWOW64\CScript.exe Filename.js

(this one is for 32-bit version, the path names are in fact quite confusing, since Microsoft uses System32 folder for 64-bit programs in a 64-bit system).

How to delete quotes without removing the symbol from a database

$
0
0

In order to delete quotations from a local database manually, we can use Quotations Editor (Symbol–>Quote Editor), then mark the required range of quotes and press Delete button. To mark a range – it is enough to click on the first line of the range, then scroll to the other line, hold SHIFT and click on the end-line of the range. To multi-select individual lines, hold down CTRL key while clicking on the lines.

Delete quotes

There is also a way to delete quotations programmatically with use of OLE automation interface explained here:

http://www.amibroker.com/guide/objects.html

The following code presents how to do it using automation scripts (the code deletes all quotations of MSFT ticker):

// THIS IS NOT AFL
// This is Windows script to be run from the outside of AmiBroker
function RemoveAllQuotes( Name )
{
    AB = new ActiveXObject("Broker.Application");
    Stk = AB.Stocks( Name );
    Quotes = Stk.Quotations;
    iQty = Quotes.Count;
    for( i = iQty - 1; i >= 0; i-- )
    {
       Quotes.Remove( i );
    }
    AB.RefreshAll();
}
RemoveAllQuotes("MSFT");
WScript.Echo ( "Completed" );

The code above is intended to be used from the outside of AmiBroker.

To use above code follow these steps:

  1. Open Notepad
  2. Copy-paste above the code
  3. Save the file with .JS extension (which means that system will treat this as JScript code)
  4. Make sure that AmiBroker is running with desired chart as active one
  5. Double click on .JS file to execute the JScript code

IMPORTANT: if you are running 64-bit Windows and have BOTH 32-bit and 64-bit versions of AmiBroker installed the OLE scripts by default would only talk to 64-bit instance. To use 32-bit version instead you would need to follow advice given in this article: “Running OLE automation scripts with 32- and 64-bit versions of AmiBroker”

Using the very same method you can delete quotes selectively, for example the script below deletes only quotes having zero volume:

// THIS IS NOT AFL
// This is Windows script to be run from the outside of AmiBroker
function RemoveQuotesWithZeroVolume( Name )
{
     AB = new ActiveXObject("Broker.Application");
     Stk = AB.Stocks( Name );
     Quotes = Stk.Quotations;
     iQty = Quotes.Count;
     cnt = 0;
     for( i = iQty - 1; i >= 0; i-- )
     {
        qt = Quotes.Item( i );
        if( qt.Volume == 0 ) 
        { 
           cnt++;
           Quotes.Remove( i );
        }
     }
    
     AB.RefreshAll();

     return cnt;
}
n = RemoveQuotesWithZeroVolume("MSFT");
WScript.Echo ( "Removed " + n + " quotes with zero volume" );

Drawing line extensions on future bars using AFL

$
0
0

AmiBroker allows to display the AFL-based chart output on the future blank bars area with use of XSHIFT argument of the Plot function. This functionality allows to move the particular chart by certain number of bars and place the output within the blank bars area (provided that we use positive value for XSHIFT, i.e. we are shifting the chart to the right).

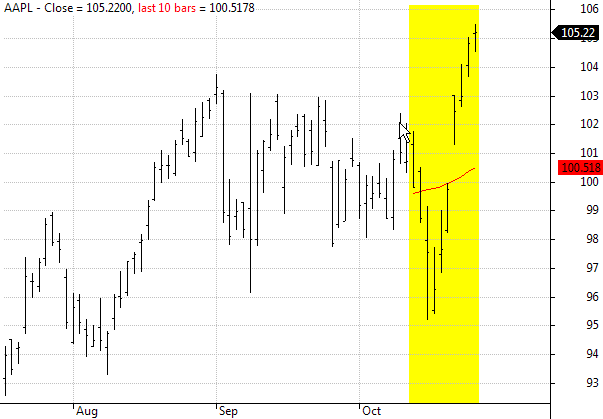
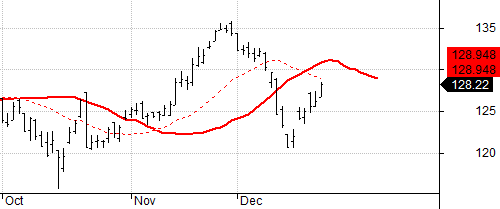
The following code shows price chart with 20-period MA overlay and additionally – with the same 20-period MA shifted to the right.

PlotClose"Close"colorDefaultstyleBar );

PlotMAClose20 ), "MA-20"colorRedstyledashed );
PlotMAClose20 ), "MA-shift"colorRedstyleThickNullNull10);

Chart with XShift

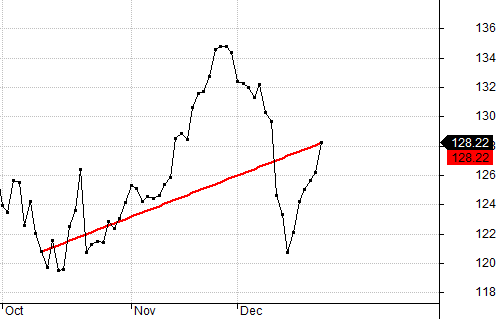
However – there may be some situations where we not only want to shift the chart position, but actually calculate the position of the line on the blank bars, for example if we are producing an extension of the existing indicator line.

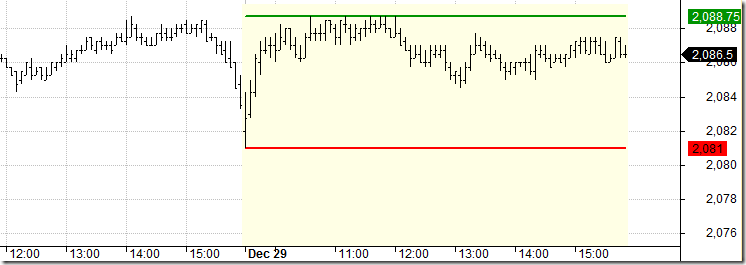
Let us consider a simple example, which draws a line connecting the last record of the input array with the value 50-bars ago, using LineArray() function.

The code is the following:

inputArray Close;
PlotinputArray"input"colorDefaultstyleDots );

bi BarIndex();
lvbi LastValuebi );
x0 lvbi 50;
x1 lvbi;
y0 inputArraylvbi 50 ];
y1 inputArraylvbi ];

PlotLineArrayx0y0x1y1True True ), "line"colorRedstyleThick );

and the output looks like this:
Chart with XShift

LineArray function allows to calculate the extension automatically if we set EXTEND argument to True, however – all the calculations in AFL language are performed within the ‘real bars’ area, i.e. on the available elements of the array, between array item 0 until array item (Barcount-1).

The calculations past the very last bar are not possible, because that would require a longer array than the one we work on.

Therefore – we need the following approach:

  1. first we shift the input back (to the left) by N bars, so the real input data would occupy earlier part of the array and we would have extra bars at the end for the calculation of extended arrays
  2. now we calculate the position of arrays on such shifted
  3. shift the displayed output forwards with XSHIFT functionality of Plot function (so the calculated extensions would get aligned onto the blank bars as a result).

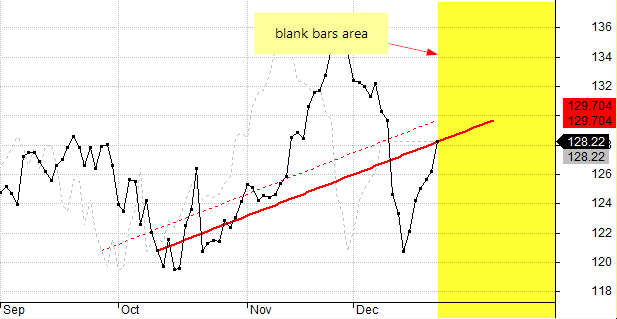
If our original input array contains 200 bars and the line was drawn between bar 150 and the bar 200, then our aim is to shift the array that way, so the line would occupy the bars between bar 140 and bar 190, while the remaining 10 bars at the end of the array could be used for calculating the extended part of the line. Then – using XSHIFT we could place the array back into its original position.

inputArray Close;
PlotinputArray"input"colorDefaultstyleDots );

// here we shift the input array to the left
shift 10;
inputArray RefinputArrayshift );

// calculations of the x-y coordinates of the LineArray
// take into account the fact that array has been shifted
bi BarIndex();
lvbi LastValuebi );
x0 lvbi 50 shift;
x1 lvbi shift;
y0 inputArraylvbi 50 shift ];
y1 inputArraylvbi shift ];

// lineArray shifted back to original (correct) position with XSHIFT
PlotLineArrayx0y0x1y1TrueTrue ), "line"colorRedstyleThickNullNullshift );

//positions that were used for calclations before using xshift
PlotinputArray"input shifted"colorLightGreystyleDashed );
PlotLineArrayx0y0x1y1TrueTrue ), "line shifted"colorRedstyleDashed );

Chart with XShift

Dashed lines in the above chart show the shifted positions of the input array and calculated LineArray before using XSHIFT (i.e. on the bars that were used for actual calculations)

Deleting symbols with comma in the name

$
0
0

When importing symbols into the database, we may sometimes encounter situations, when as a result of user-mistake we import erroneous ticker names into our database. This may for example happen when we specify an incorrect column separator in ASCII importer (or use incorrect import definition that does not match the imported file) or when we use input file that contains commas when importing watchlist members using Symbol->Watchlist->Import.

As a result – we may end up with a ticker list like this:

Problematic symbols

In this case marking the symbols in Symbols window and using Delete option from the context menu will not work, because AmiBroker treats the comma as a separator between symbols.

To solve the problem – with relatively few tickers we can always just open Symbol->Information window and fix the names in there. However – with a larger group of symbols it will not be very practical.

In such case, in order to delete the incorrect symbols from the database – we can use Symbol->Organize Assignments window, mark the tickers in left-hand-side panel and press Delete to remove these symbols.

Removing problematic symbols

There is also a way to delete the symbols manually from the database folder by removing respective data-files. This requires the following steps:

  1. Exit AmiBroker
  2. go to respective subfolder of the database folder (in Windows Explorer)
  3. delete data-files for the particular symbols
  4. delete broker.master file from the database folder (it stores the symbol list)
  5. restart AmiBroker and load the database

How to fix side-by-side configuration error in 64-bit version

$
0
0

When 64-bit version of AmiBroker is installed, the setup program checks in the system registry if required runtime libraries are present, and if not – then it downloads and installs proper runtimes from Microsoft website. However – it may sometimes happen that the information in the system registry indicates that the required runtimes are installed, while in fact they are missing or incomplete. In such situations we may see the following error displayed when launching AmiBroker:

The application has failed to start because its side-by-side configuration is incorrect. 
Please see the application event log for more detail.

To fix the problem we need to install Microsoft C++ runtime libraries vcredist_x64.exe manually. Correct x64 VC2005 runtime required by 64-bit version has the version number 8.0.50727.6195

It can be downloaded and installed from:
http://www.microsoft.com/en-us/download/details.aspx?id=26347

More documentation can be found at
http://support.microsoft.com/kb/2538242

NOTE: This article applies only to AmiBroker 64-bit from version 5.60 to 5.90. It does NOT apply to any 32-bit version of AmiBroker.

When and how often AFL code is executed?

$
0
0

All analysis in AmiBroker including charting, Analysis window or commentaries is based on underlying AFL code, which is being executed by the program to produce the required output. Therefore – any changes we see in the charts or analysis results (for example – chart updated with new ticks) mean that the program has received some input, then based on this information has recalculated the formula and presented the updated results.

These refreshes / formula recalculations depend on several factors:

  1. In a local database, which is not updated by a realtime plugin, the formula would get refreshed if we perform any actions, such as clicking, scrolling, zooming, changing parameters, choosing another symbol or interval, importing new data etc.
  2. In addition to the actions listed in (1), if we are running a plugin-based realtime feed, then the chart is refreshed based on “Intraday refresh interval” defined in Tools –> Preferences –> Intraday. If we enter 0 into this field, then it will result in chart being refreshed with every new tick (up to 10-times per sec).
  3. It is also possible to force certain refresh rate using dedicated RequestTimedRefresh() function in the AFL code: http://www.amibroker.com/f?RequestTimedRefresh
  4. It is also possible to manually refresh chart (or all chart and windows) using View->Refresh (or View->Refresh All) menu.

It is worth noting that chart formulas are refreshed only when they are placed on the active chart sheets. Non-active sheets just ‘don’t exist’, they are only created when you click on a bottom tab (sheet tab) to make them visible and destroyed immediately when other sheet becomes active. This ensures that precious CPU resources are not wasted on invisible chart sheets.

Additionally – by default charts in minimized chart windows or when multiple MDI windows are open and one is maximized, the windows in background that are completely obscured by others and/or minimized windows are not redrawn/refreshed during normal RT refresh. We can however call RequestTimedRefresh function with onlyvisible argument set to False and that will force regular refreshes in such windows as well.

RequestTimedRefreshFalse ); // force refresh for minimized MDI window or obscured MDI window

With regards to Analysis window – in general the formula is executed when we run e.g. Scan, Exploration, Backtest etc. Analysis window executes the formulas in multiple threads running in parallel (this tutorial explains multi-threading aspects: http://www.amibroker.com/guide/h_multithreading.html).

Repeated execution (to keep the code running over and over) in Analysis window can be also enabled with “Auto-repeat” option, the following Knowledge Base article explains it in details:

http://www.amibroker.com/kb/2014/10/03/how-to-setup-perodic-scans/

Last but definitely not least, we need to remember that AmiBroker may and will perform some executions internally for its own purposes such as:

  1. during AFL Syntax Check that happens when applying the chart, or sending the code to Analysis window, or updating existing formula
  2. when it is about to display Parameters window for the first time for given chart or during Parameters’ “Reset All” operation
  3. at the beginning of Optimization when it reads Optimize() statements to configure the optimization process and/or smart optimization engines
  4. at the beginning of each In-sample walk-forward step again to setup optimization parameters

Bottom line: we should never assume that certain formula will only be executed e.g. N-times during certain time-frame, because all really depends on the above factors, our actions and changing input.

How to add MAE / MFE dates to the backtest report

$
0
0

If we want to identify dates, when MAE and MFE levels have been reached during the trade lifetime – we can use the code example presented below.

The formula will process the trades one-by-one, read BarsInTrade property to know how many bars it took since trade entry till exit, then use HHVBars / LLVBars functions to identify how many bars have passed since lowest low or highest high within trade length.

With the information that highest or lowest value was observed N-bars ago – it will shift Date/Time array accordingly – so with use of Lookup() function pointing at the exitbar – we can read the date when HHV/LLV was observed within trade lifetime (BarsInTrade).

SetCustomBacktestProc"" );

function processTradetrade )
{
    dt DateTime();

    SetForeigntrade.Symbol );

    llvDate LookupRefdt, - LLVBarsLowtrade.BarsInTrade ) ), trade.ExitDateTime );
    hhvDate LookupRefdt, - HHVBarsHightrade.BarsInTrade ) ), trade.ExitDateTime );

    if ( trade.IsLong() )
    {
        maeDate llvDate;
        mfeDate hhvDate;
    }
    else
    {
        maeDate hhvDate;
        mfeDate llvDate;
    }

    RestorePriceArrays();

    trade.AddCustomMetric"MFE Date"DateTimeToStrmfeDate ) );
    trade.AddCustomMetric"MAE Date"DateTimeToStrmaeDate ) );
}

if ( Status"action" ) == actionPortfolio )
{
    bo GetBacktesterObject();

    bo.Backtest); // run default backtest procedure

    for ( trade bo.GetFirstTrade(); tradetrade bo.GetNextTrade() )
    {
      processTradetrade );

    }

    for ( trade bo.GetFirstOpenPos(); tradetrade bo.GetNextOpenPos() )
    {
      processTradetrade );
    }

    bo.ListTrades();
}

Buy CrossMACD(), Signal() );
Sell CrossSignal(), MACD() );

Using Exclude statement to skip unwanted optimization steps

$
0
0

Sometimes when we optimize our system, we may want to use only a subset of all parameter permutations for our analysis and ignore the others that do not meet our requirements.

For example – if we test a simple trend-following strategy, where we enter long position when short MA crosses above long MA using code such as:

shortPeriods Optimize("Short MA"1011001);
longPeriods Optimize("long MA"5011001);

Buy CrossMACloseshortPeriods), MACloselongPeriods) );
Sell CrossMACloselongPeriods), MACloseshortPeriods) );

Then, shortPeriods parameter value should remain smaller than longPeriods, otherwise the trading rules would work against the main principle of the tested strategy.

There is an easy way to ignore the unwanted sets of parameters by using Exclude statement in our code. If the variable is true – the backtester will not calculate any statistics for that particular run:

shortPeriods Optimize("Short MA"1011001);
longPeriods Optimize("long MA"5011001);

Buy CrossMACloseshortPeriods), MACloselongPeriods) );
Sell CrossMACloselongPeriods), MACloseshortPeriods) );

Exclude shortPeriods >= longPeriods;

The information from Info tab of Analysis window shows the difference between first execution (all 10000 backtest runs) and second one using Exclude statement. Note reduced number of steps and reduced optimization time.

Exclude results

Using IB controller (auto-trading interface) with 64-bit version of AmiBroker

$
0
0

AmiBroker allows to automate orders execution through Interactive Brokers account. In order to use the auto-trading capabilities it is necessary to install special component that communicates with IB TWS – the interface installer and documentation is available at:

http://www.amibroker.com/at/

By default the IB controller is installed to 32-bit release installation folder. So – that is the following location in 64-bit Windows system:

C:\Program Files (x86)\AmiBroker

If we are using 64-bit version, then it is necessary need to manually copy BrokerIB.exe and BrokerIB.xml files to the installation folder of 64-bit version, by default that is:

C:\Program Files\AmiBroker

How to show date axis in a newly created chart pane

$
0
0

When we double-click on the selected indicator in Charts window to display it in a new chart pane or apply our custom code as indicator, by default most of the indicator formulas will not show the date-axis, unless we specified such requirement in our formula.

In order to display the date axis, we need to click on the chart with the right mouse button, choose Parameters->Axes&Grid tab, then set Show date axis option to YES.

Axis&Grid

There is also a way to pre-code such condition in our custom indicator formula. To enable data-axis display when we apply the new indicator formula, we just need to add relevant SetChartOptions() function call:

SetChartOptions0chartShowDates );

// sample custom indicator
PlotRSI(), "RSI"colorRed );

More information about SetChartOptions function can be found in the AFL reference:
http://www.amibroker.com/f?SetChartOptions

Checking relationship between multiple moving averages

$
0
0

When we compare the positions of several lines against one another, we need to remember about using correct operators, so our AFL statement return correct results. Let us consider a set of moving averages using 10, 20, 30 and 40 periods, drawn with the following code:

MA10 MAClose10 );
MA20 MAClose20 );
MA30 MAClose30 );
MA40 MAClose40 );

PlotClose"Close"colorDefaultstyleBar );
PlotMA10"MA10"colorRed );
PlotMA20"MA10"colorBlue );
PlotMA30"MA10"colorGreen );
PlotMA40"MA10"colorgrey40 );

Multiple Moving averages

When we want to specify a condition where MA10 is highest of all of the lines, above MA20, which is above MA30 and with MA40 on the very bottom – we can NOT simply write:

condition MA10 MA20 MA30 MA40// WRONG - NOT what we really want, but no syntax error

It may seem strange that such statement is accepted without an error but it is actually syntactically correct. This is because of the fact that True and False are represented by numbers 1 and 0 respectively, so all comparisons actually have numerical value that allows such statement to be evaluated and yield numeric result. The above statement is evaluated from left to right and would be an equivalent of:

condition = ( ( MA10 MA20 ) > MA30 ) > MA40// again WRONG

Using > operator will return an array of True or False values (1 or 0). Therefore – the result of MA10 > MA20 comparison (which is True, that is equal to 1) would be then compared to MA30, resulting in checking 1 > MA30, then if such condition returns False (i.e. 0 ), we would end up with 0 > MA40 comparison that would return False (0) as the final output. This is of course not what we want to get.

That is why we should use AND operator instead, because we want to check several conditions being met at the same time, that is:

MA10 is above MA20
AND // must use AND/OR to combine multiple conditions
MA20 is above MA30
AND // must use AND/OR to combine multiple conditions
MA30 is above MA40

Therefore, we should write the AFL statement the following way:

condition MA10 MA20 AND MA20 MA30 AND MA30 MA40// correct way of checking multiple conditions

So as a general guideline – if you have multiple boolean (yes/no) conditions that you want to combine into single rule, you need to use AND operator between conditions if you want True result when all conditions are met at the same time.

In a similar way, if you want a True result when any one (or more) of multiple conditions is met, then you need to use OR operator.

condition MA10 MA20 OR MA20 MA30// this will give True result if any one condition (or both) is met

How to re-import the same data without downloading them again

$
0
0

If we have already downloaded several years of historical data using AmiQuote and for any reason we need to re-import this data once again (e.g. into a new database) – there is a way to avoid re-downloading the whole history.

AmiQuote stores all downloaded data files inside of the dedicated destination folder. The exact location can be checked from AmiQuote: Tools->Settings menu:

AmiQuote settings

All recently downloaded files are stored in this folder and we can use ASCII importer in AmiBroker to pick these files manually for import. To do that please follow the steps below:

  1. Select File->Import ASCII
  2. In the open file dialog navigate to Download folder
  3. From Files of type field pick correct import definition to match the source used in AmiQuote:
    Import ASCII
  4. mark the .AQH files we want to import (to select all, it is enough to click on any of the files and hit CTRL+A, multiple file selection is also possible by clicking with CTRL or SHIFT keys pressed)
  5. press Open button to start import procedure

It is important to remember that by default each new download via AmiQuote overwrites the earlier files, so the AQH files will contain quotes from the very last download for given symbol.

More information about using ASCII importer can be found here:
http://www.amibroker.com/guide/h_amiquote.html
http://www.amibroker.com/guide/d_ascii.html

Viewing all 115 articles
Browse latest View live