Quantcast
Channel: AmiBroker Knowledge Base
Viewing all 115 articles
Browse latest View live

How to create toolbar button for custom interval

$
0
0

IMPORTANT NOTE: Before you add toolbar buttons for dozens of intervals please note that any interval can be picked from Interval Selector combo-box. If given interval is not present, you can just type it: 7m means 7-minute, 3h means 3-hour, 2D is 2-day), as shown below:

Custom time intervals

In order to add custom time-interval buttons onto the toolbar we first need to define our custom intervals in Tools->Preferences->Intraday:

Custom time intervals

Now, in order to customize the toolbar go to Tools-> Customize menu. That switches AmiBroker into special customization mode.

Now, while keeping the customize dialog open, we can just go to View->Intraday menu and pick the items we need, then start dragging it with the mouse cursor to the toolbar of our choice.

Custom time intervals

If we keep holding down CTRL key while dragging the items, a copy will be created on the toolbar, so the items will not be removed from the original menu.

Custom time intervals

It is also possible to replace the default text-description with a button image. This is further explained in the manual:
http://www.amibroker.com/guide/h_customizeui.html


Using per-symbol parameter values in charts

$
0
0

Parameter values in AmiBroker are stored separately for each ChartID. A ChartID is a number that uniquely identifies chart. This makes it possible that parameters having same name can hold different values when they are used in different charts (different ChartIDs). This also allows to share parameters if two panes use same ChartID. (A detailed explanation can be found here: http://www.amibroker.com/kb/2014/10/06/relationship-between-chart-panes/ )

For this reason, if we want to have separate chart parameters for each symbol, we need to set up separate chart for every symbol. To do so, follow these steps:

  1. create several new chart windows using File->New->Blank Chart (or choosing New Blank Chart from the menu under + button in MDI tabs area)
    New Blank Chart
  2. drag Price( all in one) formula or any other indicators onto each of the newly opened windows
    Drag-drop chart
  3. select different active symbol for every chart
  4. define parameters individually and save the whole layout in the Layouts window

As a result – we have a setup of several chart windows, where we can quickly access given symbol showing chart with its separately stored parameters.

MDI Charts

There is also a way to handle the chart parameter values directly from the AFL formula, which would detect the active symbol and set the parameter values accordingly. Here is an example of such implementation using switch statement:
http://www.amibroker.com/guide/keyword/switch.html

To display this chart, open the Formula Editor, enter the following code and then press Apply Indicator button.

// detect the active symbol and store in n variable
Name();

// set parameter values based on the symbol name
switch ( )
{
// values for MSFT symbol
case "MSFT":
    MA1periods 10;
    MA2periods 21;
    break;

// values for IBM and NVDA
case "IBM":
case "NVDA":
    MA1periods 30;
    MA2periods 40;
    break;

// values for other tickers
default:
    MA1periods 50;
    MA2periods 100;
    break;
}

PlotClose"C"colorDefaultstyleBar );

PlotMACloseMA1periods ) , "MA(" MA1Periods ")" colorRed );
PlotMACloseMA2periods ) , "MA(" MA2Periods ")"colorBlue );

This way we can handle all individual parameter values within a single chart pane.

Indicators based on user values rather than standard OHLC prices

$
0
0

Sometimes we may want to calculate indicators based not only on standard OHLC prices but on some other user-definable values. Some functions like RSI or CSI have additional versions (RSIa, CCIa respectively) that accept custom input array. In this case it is very easy to calculate the indicator based on user defined value. For example RSI from average of High and Low prices could be written as follows:

customArray = ( High Low ) / 2;

PlotRSIacustomArray14 ), "RSI from (H+L)/2"colorRed );

But many of the built-in indicators available in AFL as functions refer indirectly to standard OHLC arrays and their parameters do not offer array argument as one of inputs.

Fortunatelly there is an easy way to provide custom array as input for any other built-in functions. For this purpose, it is enough to override OHLC arrays (or just Close if the indicator only uses Close as input) within the code before calling given function and assign our custom array. As a simple example, let us consider calculating MACD indicator out of average of High and Low prices as input.

procedure SaveRestorePricesDoSave )
{
  global SaveOSaveHSaveLSaveCSaveV;
  
  if( DoSave )
  {
     SaveO Open;
     SaveH High;
     SaveL Low;
     SaveC Close;
     SaveV Volume;
  }
  else
  {
    Open SaveO;
    High SaveH;
    Low SaveL;
    Close SaveC;
    Volume SaveV;
  }
}

// save OHLCV arrays
SaveRestorePricesTrue );

// calculate our array
customArray = ( High Low ) / 2;

// override built-in array(s)
Close customArray;

// calculate our function, MACD and Signal in this case
PlotMACD1226 ), "MACD"colorRed );
PlotSignal1226), "Signal"colorBlue );

// restore OHLCV arrays
SaveRestorePricesFalse );

The code first calculates the custom array (we use just use average of High and Low prices in this example, but of course the calculations may be more complex), then assigns the result of these calculations to Close overriding the regular values stored in close array. Then – when we call MACD() function which uses Close as input – it will be based on the modified values.

The above operations do not affect the underlying database at all – the prices are overridden only for the purpose of calculation of this particular formula and other charts / indicators are not affected at all.

How to sync a chart with the Analysis window

$
0
0

When we want to sync a chart with the selected symbol in the Analysis results list, it is enough just to double-click on the particular line in the list and AmiBroker will automatically switch the selected symbol and interval to match the Analysis window.

Sync by double click

Additionally, when we browse through Scan or Backtest results, double-clicking would be an equivalent of Show arrows for all raw signals option from the context menu and would display trading arrows in the chart to match the signals generated by the formula.

If we find that double-clicking is too much work, it is possible to mark Sync chart on select option in Analysis window settings menu:

Sync chart on select

and then single click to select a chart is enough to sync the symbol in the chart. This also allows to use keyboard (up/down cursor keys) to change the selection and sync automatically.

When we have more than one chart window displayed, then Analysis window will always sync the last opened chart window.

If we want to sync multiple chart windows we can use Symbol Link feature. Once multiple windows have the same “Symbol Link” color selected, browsing through the results list in Analysis automatically will automatically sync all linked chart windows (e.g. for the purpose of showing different intervals in each of the charts).

Linking

More information about chart link functionality is available in tutorials at:
http://www.amibroker.com/guide/h_sheets.html. See also video tutorial showing how to use symbol linking: http://www.amibroker.com/video/FloatAndLink.html

How to adjust the number of blank bars in right margin

$
0
0

The default number of bars shown in the right-hand side of the chart area is defined in Tools->Preferences->Charting:

Blank bars

It is also possible to extend the blank bars area manually. Pressing END key on the keyboard will add 10 extra bars with each keystroke. Pressing HOME will reset the blank bars area back to default value from Preferences.

Number of bank bars can also be controlled using SetChartOptions() function from the code.

SetChartOptions00chartGridMiddle00100 );
PlotClose"Close"colorDefaultstyleBar );

Detailed documentation of SetChartOptions function is available in the manual:
http://www.amibroker.com/f?SetChartOptions

Troubleshooting procedure when backtest shows no trades

$
0
0

When we run backtest and get no results at all – there may be several reasons of such behaviour. The main potential causes are the following:

  1. our system does not generate any entry signals within the tested range
  2. our settings do not allow the backtester to take any trades

To verify if we are getting any signals – the first thing to do is to run a Scan. This allows us to check if we are getting any Buy or Short signals at all. If there are none, then we need to check the formula and make sure that data interval we are working on are correct (in Periodicity in Analysis->Settings->General).

If Scan works fine and returns trading signals, but backtester still does not produce any output, it usually means that the settings are wrong, i.e. the constraints set in the settings prevent trades from being opened mainly because requested position size is too big or too small.

To check what is going on, it is best to switch Report mode to Detailed log and re-run backtest.

Report - Detailed log

Once you run backtest in Detailed Log mode you will be able to find out exact reasons why trades can not be opened for each and every bar:

Detailed log output

Using the following settings may be helpful to minimize chances of not entering trades because of various constraints:

In Analysis->Settings, General tab:

  1. check if Initial Equity is high enough
  2. set Periodicity to the appropriate interval
  3. Allow position size shrinking – turn it On
  4. Round Lot Size – set it to 0
  5. in Min. Shares box enter 0.01
  6. in Min. pos. value enter 0
  7. Account Margin – set it to 100

Settings - General

in Portfolio tab, enter 0 in Limit trade size as % of entry bar volume box.

Settings - Portfolio

How to configure alerts to work with SSL e-mail accounts

$
0
0

In order to send e-mail alerts to accounts requiring SSL (secure socket layer) connection you need to follow these steps:

  1. Download and run SSL add-on from: http://www.amibroker.com/bin/SSLAddOn.exe.
    Extra steps for 64-bit installs only: By default EMailerSSL.exe program is installed into AmiBroker 32-bit installation folder – but it is also possible to use it with 64-bit version of AmiBroker with some additional steps:
    1. Create C:\Program Files (x86)\AmiBroker folder (if 32-bit version of AB is not installed)
    2. Run SSLAddOn.exe from the link above
    3. Copy EMailerSSL.exe from C:\Program Files (x86)\AmiBroker folder to C:\Program Files\AmiBroker folder

  2. Configure account in the Tools->Preferences->Alerts, for example GMail configuration looks as follows:

    Email alert configuration for GMail

  3. In certain cases the e-mails may be blocked by default Gmail account settings. If the authentication fails with an error message, it may be required to visit: https://www.google.com/settings/security/lesssecureapps and switch Access for less secure apps to Enable as shown below:

    Email alert configuration for GMail

How to add exploration results to a watchlist

$
0
0

In order to add analysis results to a selected watchlist manually, we can use context menu from the results list:

Add results to watch list

There is, however, a way to automate this process and add the symbols to a watchlist directly from the code. To do so, we need to:
– check if our Filter variable was true at least once in the tested Analysis range
– based on the above condition, use CategoryAddSymbol() function to add tickers to a watchlist.

Additionally, we can erase the watchlist at the beginning of the test if we want to store just the new results.

The code below shows how to implement this procedure in AFL.

listnum 10// we use watchlist 10 for storing results

// erase the watchlist when we process very first symbol
if ( Status"stocknum" ) == )
{
    // retrieve watchlist members
    oldlist CategoryGetSymbolscategoryWatchlistlistnum );

    // iterate through the list and remove tickers
    for ( 0; ( sym StrExtractoldlist) ) != ""i++ )
    {
        CategoryRemoveSymbolsymcategoryWatchlistlistnum );
    }
}

// sample exploration code
Filter ROCClose) > AND Volume 1000000;
AddColumnClose"Close" );
AddColumnROCClose), "ROC" );
AddColumnVolume"Volume" );

// check how many times Filter variable was true in the tested range
// if non-zero value detected, add current symbol to a watchlist
if ( LastValueCumFilter AND Status"barinrange" ) ) )  )
    CategoryAddSymbol""categoryWatchlistlistnum );

How to export quotes to separate text files per symbol

$
0
0

The following KB article: http://www.amibroker.com/kb/2006/03/04/how-to-export-quotations-from-amibroker-to-csv-file/ already explained how to use exploration to export quotes into a single text / CSV file.

If, for some reason, we need individual files for each symbol, AmiBroker offers another way of writing data to text files. This can be achieved by using fputs function that would write directly to external files. Using fputs allows us also to fully control formatting of the output data and file naming can be dynamically set based on Name() function output.

To perform the export procedure, we need to run a Scan over the list of symbols we want to export data for.

In the Analysis->Formula Editor please enter the following code:

// create folder for exporting purposes
fmkdir"C:\\DataExport\\" );

// open file for writing
// file name depends on currently processed ticker
fh fopen"c:\\DataExport\\" Name() + ".txt""w" );

// proceed if file handle is correct
if ( fh )
{
    dt DateTime();

    // write header line
    fputs"Ticker,Date/Time,Open,High,Low,Close,Volume\n"fh );

    // iterate through all the bars

    for ( 0BarCounti++ )
    {
        // write ticker name
        fputsName() + "," fh );

        // write date/time information
        fputsDateTimeToStrdt] ) + ","fh );

        //write quotations and go to the next line
        qs StrFormat"%g,%g,%g,%g,%g\n"O], H], L], C], V] );
        fputsqsfh );

    }
    // close file handle
    fclosefh );
}
 
// line required by SCAN option
Buy 0;

Now please select Tools->Send to Analysis, select the list of symbols (e.g. Apply To: Filter, pick the watchlist in the Filter dialog), set Range to All Quotations, and press Scan

How to plot daily High and Low on intraday chart

$
0
0

The AFL offers a set of time-frame functions which allow to use multiple intervals within a single formula (the topic is explained in details in the following tutorial chapter: http://www.amibroker.com/guide/h_timeframe.html)

In situations, where we do not need to calculate any indicators based on higher interval data, but rather just read OHLC, V or OI arrays – TimeFrameGetPrice is the most convenient function to use.

To plot daily High and Low levels we just need to read the respective arrays calling: TimeFrameGetPrice(“H”, inDaily ) – the first argument specifies the array we want to read, the second argument defines the interval we are reading data from. As with any other TimeFrame functions – we can only read data from higher intervals, so it is possible to read daily data when we work with 1-minute quotes, but not the other way round.

Here is a sample formula which draws daily high and low in the intraday chart:

PlotClose"Close"colorDefaultstyleBar );
PlotTimeFrameGetPrice("H"inDaily ), "day high"colorGreenstyleStaircase styleThick);
PlotTimeFrameGetPrice("L"inDaily ), "day low"colorRedstyleStaircase styleThick); 

TimeFrameGetPrice() functions allow also to easily shift the reading by N-bars of the higher interval if we specify that in 3rd argument of the function, so calling TimeFrameGetPrice( “H”, inDaily, -1 ) will return the high of previous day.

The following code draws high / low of previous day on top of the intraday chart:

PlotClose"Close"colorDefaultstyleBar );
hlstyle styleStaircase styleThick;
PlotTimeFrameGetPrice"H"inDaily, -), "Prev High"colorGreenhlstyle );
PlotTimeFrameGetPrice"L"inDaily, -), "Prev Low"colorRedhlstyle ); 

Daily H-L

How to display indicator values in the backtest trade list

$
0
0

Backtesting engine in AmiBroker allows to add custom metrics to the report, both in the summary report and in the trade list. This is possible with Custom Backtester Interface, which allows to modify the execution of portfolio-level phase of the test and (among many other features) adjust report generation.

Due to the fact that the report generation occurs in 2nd phase of the test, when the backtester works on ~~~EQUITY ticker, we can not refer directly to given indicators. For example, to display ATR values – calling ATR() function directly is not enough, because we want to see ATR values of the traded symbol, while in portfolio-phase of the test we are no longer working on that symbol’s quotes.

So, we need to:

  1. store the values of indicators in static variables in the 1st phase of the test (when individual symbols are processed). This can be done with static variables, creating separate static variable for each symbol
  2. read stored values once the backtester reaches the portfolio phase of the test.

The following formula shows how this can be coded. The formula below displays the value of ATR indicator for the entry bar of given trade:

SetCustomBacktestProc"" );

if ( Status"action" ) == actionPortfolio )
{
    bo GetBacktesterObject();
    // run default backtest procedure without generating the trade list
    bo.BacktestTrue );

    // iterate through closed trades
    for ( trade bo.GetFirstTrade( ); tradetrade bo.GetNextTrade( ) )
    {
        // read ATR values and display as custom metric
        symbolATR StaticVarGettrade.Symbol "ATR" );
        trade.AddCustomMetric"Entry ATR"LookupsymbolATRtrade.EntryDateTime ) );
    }

    // iterate through open positions
    for ( trade bo.GetFirstOpenPos( ); tradetrade bo.GetNextOpenPos( ) )
    {
        // read ATR values and display as custom metric
        symbolATR StaticVarGettrade.Symbol "ATR" );
        trade.AddCustomMetric"Entry ATR"LookupsymbolATRtrade.EntryDateTime ) );
    }

    // generate trade list
    bo.ListTrades( );
}

// your trading system here
Buy CrossMACD(), Signal() );
Sell CrossSignal(), MACD() );

// assign indicator values to ticker-specific variables
StaticVarSetName() + "ATR"ATR15 ) );

Using loops with TimeFrame functions

$
0
0

AmiBroker features a powerful set of TimeFrame functions that allow combining different time intervals in single system formula. There is one aspect of TimeFrame functions that is important to understand to properly use them. When we switch to higher interval using TimeFrameSet function – the BarCount does not really change – TimeFrameSet just squeezes the arrays so we have first N-bars filled with Null values (undefined) and then – last part of the array contains the actual time-compressed values. This is explained in details here: http://www.amibroker.com/guide/h_timeframe.html

Normally it does not present any problem as long as we use array functions, because array functions check for Nulls occuring at the beginning of the data series and skip them appropriately. The story is different when we try to use loops.

If we want to use looping code in higher time-frame, we can not really start our calculations from the bar 0, because it would contain Null instead of real data. That is why we would first need to detect were the actual compressed data begins and start calculations on that particular bar instead.

Here is a sample formula showing how to compute AMA function in a loop, based on weekly data (the code should be applied in Daily interval). Code will identify the first non-Null bar and initialize the first AMA value with Close of that bar, then it will continue calculations

PlotClose"Close"colorBlack );

// switch to higher timeframe
TimeFrameSetinWeekly );

smooth 0.2;
myAMA Close;

// search for start (non-null) bar
for( start 0start BarCountstart++ )
{
   if( NOT IsNullClosestart ] ) ) break;
}

// looping code
for ( start 1BarCounti++ )
{
    // this part will execute only after the first non-null bar has been identified
    myAMA] = Close] * smooth myAMA] * ( smooth );
}

// regular AMA function for comparison
weeklyAMA AMAClose0.2 );

//restore original time-frame
TimeFrameRestore();

// plot expanded values retrieved from Weekly frame
PlotTimeFrameExpandmyAMAinWeekly ), "weekly AMA loop"colorRed );
PlotTimeFrameExpandweeklyAMAinWeekly ), "weekly AMA"colorBluestyleDots );

The code above is good for pre-5.90 versions. In version 5.90 we have a new function that counts Nulls for us making the code shorter and clearer, as shown below:

Version5.90 );

PlotClose"Close"colorBlack );

// switch to higher timeframe
TimeFrameSetinWeekly );

smooth 0.2;
myAMA Close;

// new 5.90 function that counts leading Nulls
start NullCountClose );

// looping code
for ( start 1BarCounti++ )
{
    // this part will execute only after the first non-null bar has been identified
    myAMA] = Close] * smooth myAMA] * ( smooth );
}

// regular AMA function for comparison
weeklyAMA AMAClose0.2 );

//restore original time-frame
TimeFrameRestore();

// plot expanded values retrieved from Weekly frame
PlotTimeFrameExpandmyAMAinWeekly ), "weekly AMA loop"colorRed );
PlotTimeFrameExpandweeklyAMAinWeekly ), "weekly AMA"colorBluestyleDots );

Handling limit orders in the backtester

$
0
0

In order to simulate limit orders in backtesting it is necessary to check in the code if Low price of the entry bar is below the limit price we want to use. The following example shows an entry signal based on Close price crossing over 100-period simple moving average. The position is opened on the next bar if price drops 1% below the Close of signal bar.

BuySignal CrossCloseMA(Close100 ) );

// buy on the next bar
Buy RefBuySignal, -1);
BuyLimitPrice RefClose, -1) * 0.99;

// now we check if limit was hit
Buy Buy AND BuyLimitPrice;

// if Open price is below the limit, then we use Open for entry
BuyPrice MinOpenBuyLimitPrice );

If we want the order to be valid for more than one bar, then we can use Hold function for this purpose:

BuySignal CrossCloseMA(Close100 ) );

// buy on the next bar
Buy RefBuySignal, -1);
BuyLimitPrice ValueWhen(BuySignalClose) * 0.99;

// now we check if limit was hit
Buy HoldBuy) AND BuyLimitPrice;

// if Open price is below the limit, then we use Open for entry
BuyPrice MinOpenBuyLimitPrice );

In a portfolio-level backtest we usually advocate against using limit orders. Why? Simply because we may not have enough cash in your account to place limit orders for all possible entry candidates. If your trading system generates 100 possible entries, you would need to place 100 limit orders only to find out that eventually only few of them fired. With limited buying power, we may need to place limit orders only for the top N-scored tickers that have generated BuySignal and skip the others. To simulate the situation when we only place small set of limit orders for top ranked stocks we can use new ranking functionalities introduced in AmiBroker 5.70. Knowing the rank at this stage is required if we only want to allow orders for top-scored tickers. Let us say that we prefer symbols with smallest RSI values.

The code would look the following way: Formula first generates a ranking for all tickers included in the test (below example uses Watchlist 0), then when testing individual symbols – checks the pre-calculated rank and generates Buy signal based on that reading.

// we run the code on WatchList 0
List = CategoryGetSymbolscategoryWatchlist);
SetOption("MaxOpenPositions"3);
 
if ( Status("stocknum") == // Generate ranking when we are on the very first symbol
{
     StaticVarRemove"values*" );

     for ( 0; ( Symbol StrExtract( List, ) )  != "";  n++    )
     {
         SetForeign symbol );
        
         // value used for scoring
         values 100 RSI();
         RestorePriceArrays();
         StaticVarSet (  "values"  +  symbolvalues );
         _TRACEsymbol );
     }

     StaticVarGenerateRanks"rank""values"01224 );
}

symbol Name();
values StaticVarGet "values" +  symbol );
rank StaticVarGet "rankvalues" +  symbol );

PositionScore values;

BuySignal CrossCloseMA(Close100 ) );

// buy on the next bar
Buy RefBuySignal, -1);
BuyLimitPrice RefClose, -1) * 0.999;

// now we check if limit was hit for the symbols ranked as top 3
Buy Buy AND BuyLimitPrice AND rank <= 3;
BuyPrice MinOpenBuyLimitPrice );

// sample exit rules - 5 - bar stop
Sell 0;
ApplyStopstopTypeNBarstopModeBars51);

Detailed description of the ranking functionality used above is available in the manual at: http://www.amibroker.com/guide/h_ranking.html

How to synchronize backtesting setup on different computers

$
0
0

When comparing the output of back-tests obtained from different working machines, it is necessary to make sure that all aspects of our testing are identical, including:

  1. the database
  2. the formula used for testing
  3. the settings

In order to synchronize data – the best is to copy the entire local database folder. Using just the same data source, especially if it is real-time feed may not be enough due to different array lengths or some corrections that may have been applied in historical data on data-vendors server in between.

In case of any differences in results between two computers that is the very fist thing to check, as different input would result in different output.

To find out that the data are different you may simply create a checksum of data columns, using code like shown below:

Filter Status("lastbarinrange");
AddColumnCumHigh Low Close Open ), "Price checksum");
AddColumnCumVolume ), "Volume checksum" );
AddColumnBarIndex(), "Number of bars");
AddSummaryRows); // add total sum of columns

By running this code on both computers you can compare checksums to see if they are the same.

In order to transfer the formula and settings to the other machine it is enough to:

  1. select Analysis window
  2. use File->Save from the main menu and save the APX file
  3. open the same APX file on the other computer

If data, code and settings are identical, then the obtained results will also stay in sync.

How to restrict trading to certain hours of the day

$
0
0

In order to include time-based conditions in the back-testing code – we can use TimeNum() function to check the time-stamp of given bar and use it as input for any time-based conditions.
http://www.amibroker.com/f?timenum

In order to code a strategy that triggers trades only in certain hours of the day, 9:30-11:00 in this example, we can use the following approach (code uses simple MACD crossovers to generate signals):

tn TimeNum();
startTime 93000// start in HHMMSS format
endTime 110000;  // end in HHMMSS format
timeOK tn >= startTime AND tn <= endTime;

Buy CrossMACD(), Signal() ) AND timeOK;
Sell CrossSignal(), MACD() ) AND timeOK

It is also possible to force an exit signal after 11:00 to avoid overnight positions:

tn TimeNum();
startTime 93000// start in HHMMSS format
endTime 110000;  // end in HHMMSS format
timeOK tn >= startTime AND tn <= endTime;

Buy CrossMACD(), Signal() ) AND timeOK;
Sell = (CrossSignal(), MACD() ) AND timeOK) OR CrosstnendTime ); 

How to measure price / percentage distance on the chart

$
0
0

The easiest way to manually measure distance between two points on the chart is to use a regular trend-line drawing tool for this purpose.

First we need to draw the line between the selected points (Insert->Trendline). It may be useful to have Insert->Snap to Price option marked if we want our line to start and end exactly at OHLC levels of respective price bar.

Once trend line is drawn, we need to hover the mouse cursor over the line and the tooltip will show both price and percentage change between the Start and End points:

Measure distance

How to find correct symbol for Interactive Brokers data

$
0
0

Sometimes Interactive Brokers symbology may be difficult to figure out. It is however very easy to find out proper symbol using Contract Description window in the TWS.

The general format for symbols that AmiBroker uses to access Interactive Brokers’ data is:

SYMBOL-EXCHANGE-TYPE-CURRENCY

The symbols must be entered in UPPER case. CURRENCY may be skipped if it is USD. TYPE can be skipped if it is STK (stock). EXCHANGE can be skipped if it is SMART.

To find correct symbol using TWS follow these steps:

  1. Select desired symbol in TWS
  2. Click on the line with right mouse button and select Contract Info->Description menu

    TWS Contract Description menu

  3. Now read the values from the Description window and use them to build proper symbol for IB plugin

    TWS Contract Description window

As per rules mentioned above, if CURRENCY is USD it may be skipped so we can use either ESZ4-GLOBEX-FUT-USD or ESZ4-GLOBEX-FUT.

For non-US symbols the procedure is the same, so TESCO PLC would be TSCO-SMART-STK-GBP. In this case we can not skip SMART and STK because we need to specify currency, and it is 4th part of the symbol. If we skipped SMART and STK, IB plugin would think that GBP is second part of dash delimited string and interpret it as exchange, and this is NOT what we want.

How to verify if EOD data is available for download at Google Finance

$
0
0

AmiQuote downloader allows to get free quotes from a number of sources included Google Finance. AmiQuote works like a specialized web-browser, so the quotations can be downloaded if they are accessible at the website of that particular data-vendor. In case of Google Finance downloads, not every symbol that is present on their site is available for historical download.

Google Finance page does NOT allow downloading historical data for non-US (international) symbols and some indices.

If you have trouble downloading particular symbol (you are getting errors in AmiQuote), chances are that Google Finance does not allow downloading data for this symbol. To verify that we need to look for Download to spreadsheet link on Google Finance page as instructed below:

  1. Visit http://finance.google.com/
  2. Use Search field to find the symbol we need, e.g. MSFT
  3. Go to Historical Prices section and look for Export: Download to spreadsheet

Historial Prices

If Export: Download to spreadsheet is present, it means that historical data are available for download. If the link is NOT present – it means no data for download. As you can see in the picture below, the link is present for US stocks like MSFT:

Historial Prices

But Download to spreadsheet link is missing for SP500 and PLC (Traded on London Exchange) – as you can see using these two links:
Historical Prices page for SP500 (no download link)
Historical Prices page for TESCO, PLC (no download link)

How to display correlation between symbols

$
0
0

For the purpose of calculating the correlation between two data-arrays, there is a Correlation() function in AFL which can be used.

In order to display a correlation chart, please select Analysis–>Formula Editor menu and enter the following code:

SetChartOptions0chartShowArrows|chartShowDates);
Ticker ParamStr"Symbol"Name() );
range Param"Periods"25225001);

corr CorrelationCloseForeignTicker"C"), range );
Plotcorr"Correlation " Name() + "/" ticker, 
      ParamColor"Color"colorRed ), ParamStyle"Style"styleLine ) );

// check if different symbols are used
if( ticker == Name() ) 
    Title "Please select different symbol from Parameter dialog";

Now select Tools->Apply Indicator. Initially the code will pick the selected symbol’s Close prices for both arrays, so we either need to change the selected ticker in the chart or the second symbol, which can be defined in Parameters dialog.

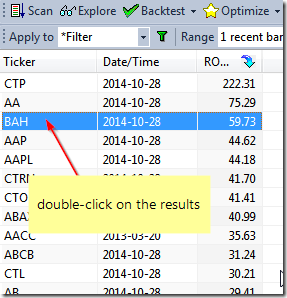
We can also use Exploration feature to display a correlation matrix e.g. for the watchlist members. The below example shows the process for Watchlist 0 members.

The formula to display correlation table looks as follows:

// read the list of symbols from Watchlist 0
symlist CategoryGetSymbolscategoryWatchlist);

// display only last bar from the Analysis range
Filter Status"lastbarinrange" );

// iterate through symbols
for ( 0; ( sym StrExtractsymlist) ) != ""i++ )
{
    // calculate correlation over 252 bars
    Corr CorrelationCForeignsym"C" ), 252 );

    // set color dynamically based on correlation values 
    // and display the output in exploration column
    Clr 32 SelectedValueCorr ) * 32;
    AddColumnCorrsym1.2, 
               ColorHSB128 Clr255255 ), 
               ColorHSBClr255255 ) );
}

SetSortColumns); 

To use the formula we need to do the following:

  1. assign some symbols to watchlist 0
  2. select Analysis->Formula Editor menu
  3. in the AFL Editor enter the code listed above
  4. select Tools->Send to Analysis menu
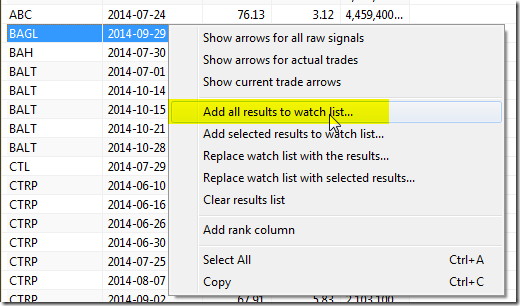
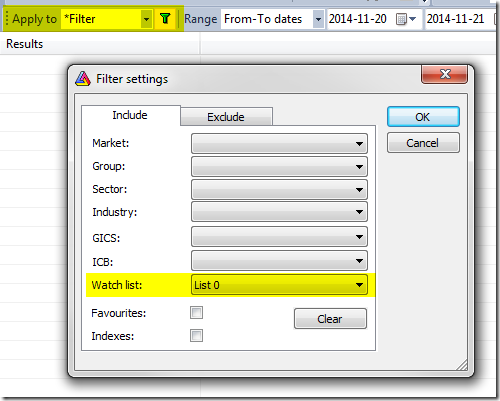
  5. in the Analysis window, select Apply to: Filter (in Include tab hit Clear and pick watchlist 0)

    Filter dialog

  6. select Range: 1 Recent bar (in case of longer range, last bar of the range will be used for output)
  7. press Explore button

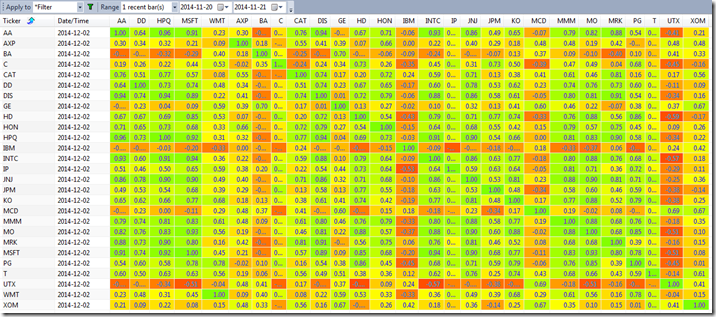
Here is a sample output table:

Correlation Matrix

Be careful and try not to put 10000 items in the watch list because it would need to create a table with 10K columns. Windows has some limits on pixel width of the list view and it would truncate display when the display width (scrollable area inside list) exceeds 32767 pixels. That makes it practical only to display matrices of not more than about 1000-2000 columns.

How to backtest symbols individually

$
0
0

By default, when we run backtest over a group or watchlist of symbols – AmiBroker will perform a portfolio test. However, there is also an Individual mode of the backtest available, where every symbol is tested individually and independently.

Once we send the formula to Analysis window and define group of symbols to run code on (Apply To), in order to run an individual backtest, it is necessary to unfold the menu next to Backtest button and choose Individual Backtest from the menu.

Individual Backtest

To get full report generated for each of the tests, it is required to first go to Analysis–>Settings->Report tab and mark Generate detailed reports for each symbol in individual backtests option.

Individual Backtest Report

Then the full reports can be accessed through the Report Explorer.

Report Explorer

The letter I indicates that the report contains results of an individual test. Double-clicking on the particular results line will show full contents of the backtest report.

Report Explorer List

Viewing all 115 articles
Browse latest View live