Quantcast
Channel: AmiBroker Knowledge Base
Viewing all 115 articles
Browse latest View live

How to manage overlapping entry/exit signals in portfolio test

$
0
0

When we run the portfolio-test and use default backtesting procedure – on each bar AmiBroker will first process exit signals, then use entry signals to open new trades.

There may be some strategies however, where this approach may not be enough. For example – if we simulate entries with limit price (so they occur somewhere in the middle of the day), but exits on Close – then if we do not use any margin loan, the funds from exit signals can only be used on subsequent days.

Since trading prices (BuyPrice, SellPrice, ShortPrice, CoverPrice arrays) don’t carry any timing information, but only the information about price level for given trade – then we need to delay release of funds by one day to get correct results. This can be done with the following command:

SetOption("SettlementDelay");

The unsettled cash is reported in the Detailed Log:

Detailed log

We need to remember that this option works on Days (not bars) and it may be better to use it with backtestRegularRaw instead of backtestRegular, otherwise some trades may not be entered because funds are not settled immediately – so we may need to be able to enter not on first but subsequent buy signals (all would really depend on the particular trading rules) – the behaviour of backtestRegular mode and processing raw signals is explained here: http://www.amibroker.com/guide/h_portfolio.html


Customizing chart titles

$
0
0

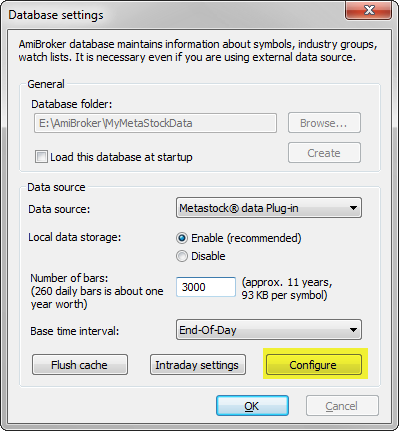
When we create custom indicators in AmiBroker, then by default the program will automatically create chart title line based on the selected ticker and the information we have provided in Plot function calls.

If we use the following formula:

PlotClose"Close"colorDefaultstyleBar );
PlotMAClose20), "MA-20"colorRed );
PlotMAClose50), "MA-50"colorBlue );

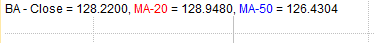
Then the auto-generated chart title line will contain:

Chart title

First item is the symbol name selected for that particular chart window (BA in this case), then the output is based on the plot names (provided in the 2nd argument of Plot function calls within the code) and colors will also match the respective plot colors. Number of decimal places depends on the settings in Tools->Preferences->Miscellaneous: Decimal places in chart titles/tools

If we do not want certain plot to affect the chart titles, we can use styleNoTitle chart style, for example changing the 3rd line of the above code into:

PlotMAClose50), "MA-50"colorBluestyleNoTitle );

Would result in removing MA-50 values from the title output presented above, even though MA-50 values are still presented in the chart.

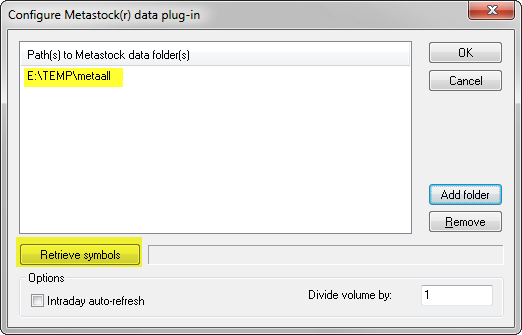
We can customize the chart title output even further by means of dedicated Title variable. If we define Title string within the formula, it will override the automatic title generation. Therefore, starting with most basic example, defining an empty string with use of:

Title "";

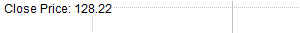
would hide the title output completely, while using statement like this:

Title "Close Price: " +NumToStrClose1.2 );

would generate default-color output such as the following (the price is formatted to use 2 decimal places by using NumToStr function in this case):

Chart title

It is also possible to define chart color by using EncodeColor() function, so changing the above line into:

Title "Close Price: " +EncodeColorcolorRed ) + NumToStrClose1.2 );

would result in displaying the price value (and other text that follows the EncodeColor call) in red color.

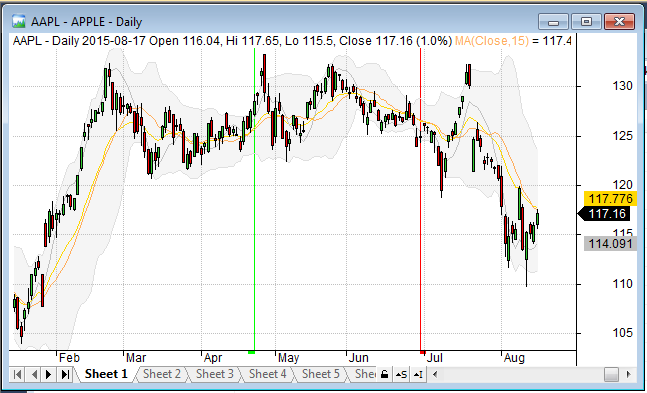
Now let us analyse the Title definition included in the built-in Price chart.

_N(Title StrFormat("{{NAME}} - " +FullName() +
   " - {{INTERVAL}} {{DATE}} Open %g, Hi %g, Lo %g, Close %g (%.1f%%) Vol " +
   WriteValV1.0 ) +" {{VALUES}}"OHLCSelectedValueROCC)) ));

Among other elements shown above, the Title definition uses templates like {{NAME}} or {{VALUES}} etc. in the defined string.

These are special tokens that are replaced by appropriate values at run-time:

  1. {{VALUES}} inside Title string will be replaced by automatic-values generated by Plot function calls
  2. {{NAME}} will be replaced by the ticker symbol
  3. {{DATE}} will be replaced by selected date
  4. {{INTERVAL}} will be replaced by the name of the interval
  5. {{OHLCX}} will be replaced at runtime by string “Open …, Hi …. Lo … Close (…%)” showing current price

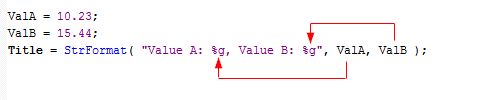
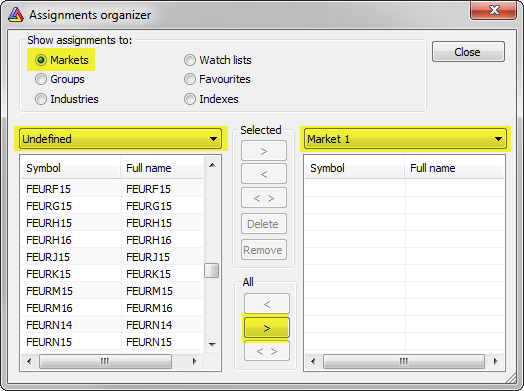
The built-in title definition uses also StrFormat function. This function allows us to specify the string followed by the list of arguments that will be inserted into the string in places, where %f, %g or %e specifications are entered.

Chart title

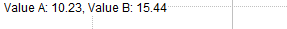
If we use the code like the one above, it would produce the following output:

Chart title

Those specifications allow us to format the output string accordingly.

  • %.0f will output a number without decimal places (with rounding if necessary), such as 393
  • %.1f will output a number with 1 decimal place, such as 392.7
  • %.2f will output a number with 2 decimal places, such as 392.65
  • %.3f will output a number with 3 decimal places, such as 392.651
  • %.4f will output a number with 4 decimal places, such as 392.6510
  • %e will output scientific notation (mantissa/exponent), such as 3.92651e+2 (3.92651 * 10 ^ 2 )
  • %g uses automatic formatting and displays as many decimal places as required to show full precision of given number (392.651)

The documentation of the StrFormat function is available in the manual

http://www.amibroker.com/f?StrFormat

In the above example the whole title definition is enclosed with _N() function. This just prevents from displaying the title string within the Interpretation window, so using _N() does not really affect the output within the chart.

Choosing first day of the week for weekly compression

$
0
0

AmiBroker allows to define, what days to use for weekly compression. By default weekly compression uses Monday-Sunday week (i.e. Monday being the first day of the week), we can change it however to any custom day of the week to match our local calendar.

To choose the day to be used as the first day of the week, we need to go to File->Database Settings->Intraday Settings and choose the appropriate day in “First day of week” field.

Database Settings

The above example shows custom-defined week, which starts on Sunday and ends on Saturday (i.e. working Sunday-Thursday week, as in many Middle East countries).

The following Wikipedia article specifies the working week for a number of countries in the world:
http://en.wikipedia.org/wiki/Workweek_and_weekend

How to handle delisted symbols in rotational test

$
0
0

This Knowledge Base article: http://www.amibroker.com/kb/2014/09/26/closing-trades-in-delisted-symbols/ explains how to close trades in delisted symbols in regular backtest (to avoid holding delisted stocks in the trade list and have our max symbol limit impacted by those positions).

In rotational test however we cannot use Sell variable, because trades are driven by symbols’ ranking by PositionScore values. Therefore we would need to assign zero to PositionScore variable for the exit bars respectively – this will force exiting any positions held in given stock.

EnableRotationalTrading();

bi BarIndex();
lastbi LastValuebi ) - Status("BuyDelay"); 
exitLastBar bi == lastbi;

score /*our regular positionScore*/;
PositionScore IIfexitLastBar 0score );

Note that we are adjusting the last bar index in case trade delays are set in the settings.

As in the regular test, we can also use DelistingDate information if we have it imported into Symbol ->Information window.

EnableRotationalTrading();
exitLastBar datetime() >= GetFnData("DelistingDate");

score /*our regular positionScore*/;
PositionScore IIfexitLastBar 0score );

Symbol selection when PositionScore is not defined

$
0
0

AmiBroker’s portfolio backtester allows to define stock ranking and selection criteria by means of PositionScore variable. This is explained in details in the following tutorial chapter:

http://www.amibroker.com/guide/h_portfolio.html

If PositionScore is not defined or it has the same value for two or more symbols, then AmiBroker will use the following rules:

  1. transaction with greater PositionSize is preferred – the comparison method depends on the position sizing approach used in our code:
    • If we use SetPositionSize( dollarvalue, spsValue) – then $ value is compared.
    • If we use SetPositionSize( shares, spsShares) – then number of shares is used for comparison.
    • If we use SetPositionSize( perc, spsPercentOfEquity) – then % equity matters.
  2. alphabetical order
  3. long trades rather than short trades, if both occur at the same time for the same symbol.

“Invalid symbol” message for stocks traded on multiple exchanges (IB)

$
0
0

Some of the symbols available from Interactive Brokers data-feed may be traded on multiple exchanges. In such case, when we enter the symbol to the database as:

INTC
GLD
CSCO

then we may see “Invalid symbol” message displayed by the Interactive Brokers plugin, as symbol SMART-STK-USD default format is not enough to uniquely identify the symbol. Therefore we would need to specify the primary exchange for the given symbol.

The primary exchange can be specified in the symbol using -!EXCHANGE suffix, so we can write the symbol like this

INTC-!NASDAQ

and it will instruct Interactive Brokers plugin to send NASDAQ as Primary Exchange for INTC to TWS.

We can however maintain similar ticker naming for all symbols in our database and use short names for all US symbols. To make it possible there is special dictionary (or translation table) for IB symbols that both plugin and IB automated trading interface use. In AmiBroker main folder there is a IBDictionary.txt file, which we can edit with any plain text editor (like Notepad) and provide symbol translations. It describes how symbols are translated before plugin communicates with TWS API.

The format of this file is CSV (comma separated values):

InputSymbol,OutputSymbol, comment (optional)

For example:

INTC,INTC-!NASDAQ, This is because INTC is now traded on multiple exchanges, so we need to set primary exchange
CSCO,CSCO-!NASDAQ, The same as above 
MSFT,MSFT-!NASDAQ
GLD,GLD-!ARCA

Positioning area plots behind the grid lines

$
0
0

When we want to paint the background with custom colors to indicate certain states or conditions – we can use area plots style for this purpose. The code example presented below shows green background when Close stays above 50-period moving average and red when below MA-50.

PlotClose"Close"colorDefaultstyleThick);
PlotMA50 MA(Close,50), "MA50"colorBluestyleThick);

color IIfClose MA50colorGreencolorRed );
Plot1""colorstyleArea|styleOwnScale,0,);

However – by default both grid lines and the selector line would get covered by the area plot:

area chart

There is an easy fix for that – AmiBroker allows to specify the Z-axis position too, so we can shift the visibility and order of plots (including their position against grids and other elements) by means of Z-order argument of Plot function.

If we specify the Z-order argument to -1 that means we move the particular plot one level behind and this would also be located below the grids.

PlotClose"Close"colorDefaultstyleThick);
PlotMA50 MA(Close,50), "MA50"colorBluestyleThick);

color IIfClose MA50colorGreencolorRed );
Plot1""colorstyleArea|styleOwnScale,0,1,0,-); // the 8th argument specifies z-order

fixed z-order area chart

More information about use of Z-order can be found in the User’s Guide:
http://www.amibroker.com/guide/h_indbuilder2.html

How to categorize symbols coming from Metastock databases

$
0
0

Many data vendors that deliver data in MetaStock database format offer quotes in separate MS databases organized in several folders, separate for different markets or industries.

AmiBroker does not have any symbol limits, there is no need to maintain separate databases in AB and all the quotes can be placed in a single database. The configuration process of Metastock database as external data source is described here: http://www.amibroker.com/guide/h_extsources.html

AmiBroker supports internally many ways to categorise symbols into groups, markets, sectors, industries, etc. To learn more about categories available in AmiBroker please check this: http://www.amibroker.com/guide/h_categories.html

Now we may want to bring MS folder structure into AmiBroker’s category system. Sometimes data vendor would prepare appropriate automation scripts to do that work for us, but when they are not available, we can arrange the categories ourselves in the initial setup process.

To do so, we could pick the folders one-by-one, then reassign the symbols to desired categories. The process is the following:

First we configure the database:

  • Select File->New->Database menu
  • Enter the folder name and press Create
  • Choose MetaStock plugin as the datasource
  • Press Configure

MS plugin config

Now we pick single MetaStock folder (AmiBroker allows to import them all at once, however we want to avoid mixing the symbols from various folders) and press Retrieve button.

MS plugin config

After pressing Retrieve we can close the database configuration dialog (OK, then OK again), go to Symbol->Organize Assignments and reassign the newly imported symbols from Undefined market or Industry into our desired location.

MS plugin config

Now we can return to File->Database Settings->Configure, retrieve another folder and repeat the assignment for that folder and so on and so on.

It is important to mention that this is just one-time procedure. After it is done, AmiBroker will automatically read all updates directly from MetaStock files.

There are also data-vendors offering data in MS format (such as PremiumData for example) that deliver ready-to-use configuration scripts – in such case it would allow to avoid such manual setup procedure and synchronize all category assignments automatically.


How to move a window to another monitor

$
0
0

By default document windows like Charts, Analysis, Account Manager, Web Research all open inside of main AmiBroker frame window. In multi-monitor setups it may be useful however to move some of them to another screen.

Let us say we want to move Analysis window to second monitor screen. This can be done by switching the window to special “Floating” mode by using Window->Floating option from the menu after opening Analysis.

Window menu

Using floating mode detaches Analysis from the main frame and then the window can be moved outside of it.

Window menu

Exactly the same procedure works for Chart windows, Account Manager or Web Research windows.

The procedure (for chart window) has also been shown in this video:
http://www.amibroker.com/video/FloatAndLink.html

How to restore program menus and/or toolbars

$
0
0

If we unintentionally make some changes to our toolbars or main menu using customization option, there is an easy way to restore the toolbars and menus to the default settings.

All we have to do is to select Tools->Customize menu, then in the Toolbars tab of the Customize dialog, click on the item we want to restore and press Reset button.

Reset toolbar

If any toolbar is missing, please verify if it has a checkmark switched on in the list shown above.

If all of this does not help and the toolbar and/or menu are still missing, then we can reset the position of all toolbars by using REGEDIT tool and removing all entries responsible for toolbar positions. The procedure is the following:

  1. exit AmiBroker
  2. use REGEDIT tool to edit the system registry (Windows Start->Run / type in: regedit )
  3. delete all entries starting with:
    HKEY_CURRENT_USER\Software\TJP\Broker\CommandBars
    

    as presented in the picture below

Reset toolbar

How to browse charts in selected date range

$
0
0

In order to select certain range of dates in the historical chart, then scroll through the history of tickers, we can mark the range of dates we interested in using Range Markers (double-click on the chart or mark the bars and hit F12, SHIFT+F12).

Range markers

Then, use View->Zoom->Range menu to zoom the chart to our range selection.

Zoom to range

We can also assign a keyboard shortcut to View->Zoom->Range command or create a custom toolbar button to have it easily accessible (e.g. CTRL+SHIFT+R). This can be done in Tools->Customize (http://www.amibroker.com/guide/h_customizeui.html)

After we switch the symbol, in situations when the chart shifts e.g. due to different history length in those symbols – all we have to do is to hit CTRL+SHIFT+R to bring back the view to the range we wanted.

Browsing through the list of symbols can be automated further with scripts. Below is a sample auto-play script that will automatically browse through the list of symbols and will set the zoom to the dates we set in the code. All we need is just to start the script and watch it all switching automatically, without any manual actions required.

Here is a sample script that will browse through the list of symbols and set the zoom to show year 2010:

iWatchList 0/* you can define watch list number here */

AB = new ActiveXObject"Broker.Application" );
Qty AB.Stocks.Count;

for ( 0Qtyi++ )
{
    Stk AB.Stocks);

    if ( iWatchList 32 )
    {
        if ( Stk.WatchListBits & ( << iWatchList ) )
        {
            AB.ActiveDocument.Name Stk.Ticker;
            AW AB.ActiveWindow;
            AW.ZoomToRange"2010-01-01""2011-01-01" );
            WScript.Sleep2000 ); // 2 seconds delay
        }
    }
    else
    {
        if ( Stk.WatchListBits2 & ( << ( iWatchList 32 ) ) )
        {
            AB.ActiveDocument.Name Stk.Ticker;
            AW AB.ActiveWindow;
            AW.ZoomToRange"2010-01-01""2011-01-01" );
            WScript.Sleep2000 ); // 2 seconds delay
        }
    }
}

To use above code follow these steps:

  1. Open Notepad
  2. Copy-paste above the code
  3. Save the file with .JS extension (which means that system will treat this as JScript code)
  4. Make sure that AmiBroker is running with desired chart as active one
  5. Double click on .JS file to execute the JScript code

IMPORTANT: if you are running 64-bit Windows and have BOTH 32-bit and 64-bit versions of AmiBroker installed the OLE scripts by default would only talk to 64-bit instance. To use 32-bit version instead you would need to follow advice given in this article: http://www.amibroker.com/kb/2015/01/12/ole-automation-scripts-with-32-and-64-bit/

It is worth noting that going through series of charts is not the only way to compare performance of various symbols over time. There are other dedicated built tools for comparing several securities (without switching symbols, but within one chart window), including Price (Foreign) and Relative Performance indicator. These functionalities are shown in the following video:
http://www.amibroker.com/video/TwoSymbolsOneChart.html

How to run certain piece of code only once

$
0
0

There are situations where we may need to run certain code components just once, e.g. to initialize some static variables before auto-trading execution or perform some tasks (such as ranking) at the very beginning of backtest or exploration. The following techniques may be useful in such cases:

When we want to execute certain part of code just once after starting AmiBroker, we may use a flag written to a static variable that would indicate if our initialization has been triggered or not.

if( NzStaticVarGet("InitializationDone") ) == )
{
   StaticVarSet("InitializationDone"1);
   // code for first execution
}

If we want to run certain part of code at the beginning of the test run in Analysis window, we can use:

if ( Status("stocknum") == )
{
   // our code here
}

When Status(“stocknum”) is detected in the code, then execution is performed in a single thread for the very first symbol. Only after processing of this first symbol has finished the other threads will start.

A practical example showing use of this feature is presented in the following tutorial:

http://www.amibroker.com/guide/h_ranking.html

How to increase maximum periods of built-in indicators

$
0
0

Built-in indicators and averages which are shipped with AmiBroker use Param() function calls to provide the ability to adjust parameter values through Parameters window. Param function in the code specifies default, minimum, maximum values for the input arguments.

The order of arguments in Param function is the following:

Param"name"defaultvalminmaxstepsincr )

In certain situations, we may however want to use larger period settings than the pre-defined maximum. There is an easy way to adjust the code to achieve such task. Let us consider using built-in Price (all in one) indicator and setting e.g. 200 or 300 periods for Bollinger Bands (default maximum is 100).

To modify the underlying code, we need to:

  1. Click on the chart with right mouse button and choose Edit Formula from the context menu to bring up the AFL code editor
  2. In the code identify Bollinger Band section and the Param function call responsible for setting number of periods and change it from 200 to 300 as shown in the picture below.

    Param call

  3. Approve the changes, by selecting Tools->Apply from the editor’s menu

Now we can go back to Parameters dialog and we will be able to set Bollinger Bands Periods setting up to 300 periods.

How to combine multiple databases into one

$
0
0

In order to combine data stored in two separate databases within a single database we may consider one of the following options:

ASCII IMPORT/EXPORT METHOD

First of the possible ways is to export data from one database into CSV files using the procedure presented here:

http://www.amibroker.com/kb/2006/03/04/how-to-export-quotations-from-amibroker-to-csv-file/

Once we have our quotations exported into text files, we can load the other database and use built in ASCII importer to import data. The detailed procedure is outlined in the following Knowledge Base Article:

http://www.amibroker.com/kb/2014/12/29/importing-data-using-multiple-column-separators/

FILE COPY METHOD

Another way of combining the databases is to copy the individual symbols files. Each database stores individual data files within 0-9,a-z,”_” subfolders and it is possible to copy the individual data files between databases. When copying, we need to maintain the same folder pattern and copy symbols from “a” subfolder of one database into “a” subfolder of the other database (the same for other folders), so each of the symbols would land in its respective folder.

After we copy the data files, we also need to delete broker.master file from the target database folder. This is because this file stores pre-generated symbol list used for fast loading. When we delete the file, it will be reconstructed based on information from individual data files.

More information about the database structure can be found in the manual:
http://www.amibroker.com/guide/h_workspace.html

How to fill background between hand-drawn trend lines

$
0
0

Among built-in drawing tools, the Triangle, Rectangle and Ellipse allow to fill the background with custom color. However, if we wanted to fill the space between manually drawn trend lines, then we could use AFL formula with Study function that allows to detect the position of the line. Then – knowing the arrays of top and bottom lines we could fill the area between with a cloud plot.

A sample formula, which shows such implementation is presented below. The code fills the space between L1 and L2 trendlines (red color) and between upper and lower bands of the regression channel (RU and RL study id’s respectively).

// regular price plot
PlotClose"Close"colorDefaultstyleBar );

// custom function definition
function FillSpaceID1ID2color )
{
   // get current chart ID
   chartID GetChartID();
   
   // read the positions of the lines
   l1 Study(ID1chartID );
   l2 Study(ID2chartID );
   
   // draw cloud chart
   PlotOHLCl1l1l2l2""ColorBlend(colorGetChartBkColor() ), styleCloud|styleNoRescale|styleNoLabelNullNull0, -);
}


// call function and refer to the assigned study ID's
FillSpace"L1","L2"colorRed );
FillSpace"RU","RL"colorBlue );

The chart produced by the formula looks as follows:

Chart with background fill

We need to remember that each line needs to have unique Study ID assigned in the Properties window.

Properties window

In case of regression channel the ID’s of the upper and lower lines are defined in Regression Channel tab:

Properties window

If we wanted to handle more lines, then it may be more practical to process the list of study ID’s defined in a custom string instead of individual function calls.

// regular price plot
PlotClose"Close"colorDefaultstyleBar );

// custom function definition
function FillSpaceID1ID2color )
{
   // get current chart ID
   chartID GetChartID();
   
   // read the positions of the lines
   l1 Study(ID1chartID );
   l2 Study(ID2chartID );
   
   // draw cloud chart
   PlotOHLCl1l1l2l2""ColorBlend(colorGetChartBkColor() ), styleCloud|styleNoRescale|styleNoLabelNullNull0, -);
}

function BulkFillIDlistcolor )
{
    for( 0; ( ID1 StrExtractIDlist) ) != ""+= )
    {
      ID2 StrExtractIDlisti+);
      FillSpaceID1,ID2color );
    }
}

// call function and refer to the assigned study ID's
BulkFill"L1,L2,RU,RL,R1,R2"colorRed );

How to create custom import definition for ASCII importer

$
0
0

When we use File->Import ASCII to import data, we can choose import file format using one pre-defined import format definitions. As it is explained in the manual (http://www.amibroker.com/guide/d_ascii.html) it is also possible to create our custom import definitions to match data we are trying to import. This article explains all the required steps.

The easiest method to create import definition is to use File->Import Wizard. In the first page, select at least one file in the format we want to import and on the second page configure columns:

Import Wizard page 2

This all easy when we are importing quotation data, but when we are importing non-quotation data such as category assignments, we can not select appropriate columns using Import Wizard. In such case we need to type-in appropriate $FORMAT command in the “Additional commands” field of Import Wizard.

For example if we have file with categories like this:

"DDD","3D Systems Corporation","Technology","Computer Software: Prepackaged Software",1
"MMM","3M Company","Health Care","Medical/Dental Instruments",1
"WBAI","500.com Limited","Consumer Services","Services-Misc. Amusement & Recreation",1
"WUBA","58.com Inc.","Technology","Computer Software: Programming, Data Processing",1
"AHC","A.H. Belo Corporation","Consumer Services","Newspapers/Magazines",1
"ATEN","A10 Networks, Inc.","Technology","Computer Communications Equipment",1
"AIR","AAR Corp.","Capital Goods","Aerospace",1
"AAN","Aaron's,  Inc.","Technology","Diversified Commercial Services",1

We need to add the following commands in the “Additional commands” field of Import Wizard

$FORMAT Ticker,FullName,SectorName,IndustryName,Group
$OVERWRITE 1
$CLEANSECTORS 1
$SORTSECTORS 1

First line tells AmiBroker the column meaning, second line tells it to overwrite existing data. Last two lines tell AmiBroker to wipe existing category structure and sort imported sectors alphabetically. Be sure NOT to specify $CLEANSECTORS command when you do NOT want to wipe existing category structure.

We also need to mark “No quotation data” box in the second page of Import wizard to tell AmiBroker that the file that we are importing does not contain quotes and it should switch off all price checking.

Import Wizard page 2

Finally, in the last step of the wizard save the format definition:

Import Wizard page 3

Once we do this, next time we use File->Import ASCII a new selection My own format will appear in the Files of type combo box in the file selector dialog.

Import ASCII

It is worth noting that import definitions are plain text files that are stored in “Formats” subfolder of AmiBroker directory, and the list of available import definitions that appears in “Files of type” combo box, is also a plain text file called “import.types” that is located in the same subfolder. So, advanced users may also modify those files directly using plain text editor such as Notepad. It is all explained in great detail in the manual http://www.amibroker.com/guide/d_ascii.html

How to count symbols in given category

$
0
0

When we want to find out how many symbols belong to given category (such as watchlist) then for manual inspection, it is enough to hover the mouse cursor over the particular category name in the Symbols window and the information will be shown in a tooltip:

Category symbol count

If we want to check such information using AFL code, we could read the list of symbols returned with CategoryGetSymbols and by counting commas (which separate symbol names) find out the number of tickers.

A reusable function is presented below:

function CategoryCountSymbolscategorynumber )
{
   count StrCount( list = CategoryGetSymbolscategorynumber ), ",");  
   return IIf( list == ""0count );
}    

Title "Symbols in watchlist 0: " CategoryCountSymbolscategoryWatchlist);

How to read highest high value of future bars

$
0
0

Built in HHV and LLV functions allow to read highest high or lowest low of n-past bars. If we want to refer to future values, there is an easy way to do it using simple Ref function and just shift HHV or LLV reading from N-bars ahead. A ready to use function showing such approach is presented below:

// function definitions
function futureHHV( array, periods )
{
   return RefHHV( array, periods ), periods );
}
function futureLLV( array, periods )
{
   return RefLLV( array, periods ), periods );
}

// sample use
PlotClose"Close"colorDefaultstyleBar );
PlotHHVH20 ), "HHV"colorGreenstyleDashed );
PlotfutureHHVH20 ), "Future HHV"colorGreenstyleThick );
PlotLLVL20 ), "LLV"colorRedstyleDashed );
PlotfutureLLVL20 ), "Future LLV"colorRedstyleThick );

And here is the chart produced by the formula above:

Future HHV

How to show price ratio between two symbols

$
0
0

Charting ratios between the prices of two symbols can easily be done with AmiBroker. For this purpose we can use Spread built-in formula available in Charts window:

Inserting Spread formula

Then select the style as Ratio:

Parameter window

The primary symbol (Symbol1) is the one selected in the chart window, the other symbol (Symbol2) is defined in the Parameters window, as presented in the above screenshot.

It is also possible to create such ratio chart programmatically in AFL using the following code:

ratio Foreign("Symbol1""C") / Foreign("Symbol2""C");
Plotratio"ratio"colorRed );

Symbol1 and symbol2 names in the above code need to be replaced with the actual symbol names from our database we want to use.

How to write to single shared file in multi-threaded scenario

$
0
0

The problem is as follows: during multiple-symbol Scan (or any other multi-threaded Analysis operation) we want to create a single, shared file and append content generated from multiple symbols to it.

There are two things that we must consider if we are running in multiple treaded scenario.
1. If we want to get just single-run results, before appending content to the file, we need first to delete file generated in previous runs.

2. We have to take care to open the file in share-aware mode so multiple threads do not write at the same time (preventing corruption).

A sample formula is presented below.

// our scanning code
Buy CrossMACD(), Signal() );

filepath "C:\\ScanExport.txt";

if( Status("stocknum") == )
{
   // delete previous file before anything else
   fdeletefilepath );
}

// open file in "share-aware" append mode  
fh fopenfilepath"a"True );

// proceed if file handle is correct
if ( fh )
{
   lastbuyDT =  LastValueValueWhenBuyDateTime() ) ) ;

   // write to file
   fputsName() +", Last Buy: " DateTimeToStrlastBuyDT ) +"\n"fh );

   // close file handle
   fclosefh );
}
else
{
  _TRACE("Failed to open the file");
}

One important thing to remember is that in multi-threaded environment threads execute independently and there is no guarantee they will all execute sequentially, so the order of items (symbols) in the file may not be alphabetical.

If we want strictly sequential execution, then we must limit ourselves to just running in single-thread. A single-thread execution in New Analysis window can be achieved by placing the following pragma call at the top of the formula.

#pragma maxthreads 1

#pragma maxthreads limits the number of parallel threads used by New Analysis window. This command is available in AmiBroker version 6 or higher.

Viewing all 115 articles
Browse latest View live