Quantcast
Channel: AmiBroker Knowledge Base
Viewing all 115 articles
Browse latest View live

How generate backtest statistics from a list of historical trades stored in a file

$
0
0

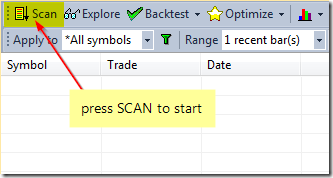
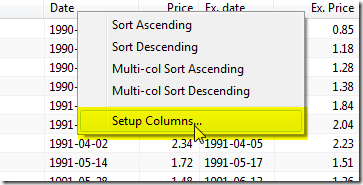
Apart from testing mechanical rules based on indicator readings, backtester can also be used to generate all statistics based on a list of pre-defined trades, list of our real trades from the past or a list of trades generated from another software.

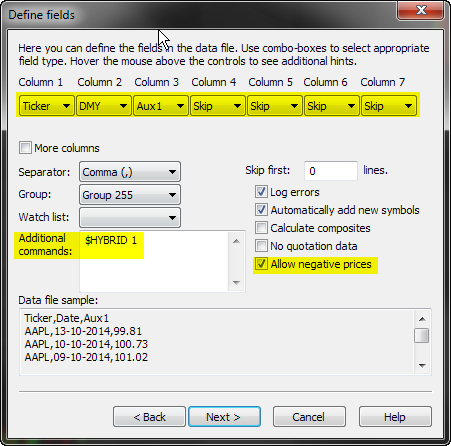
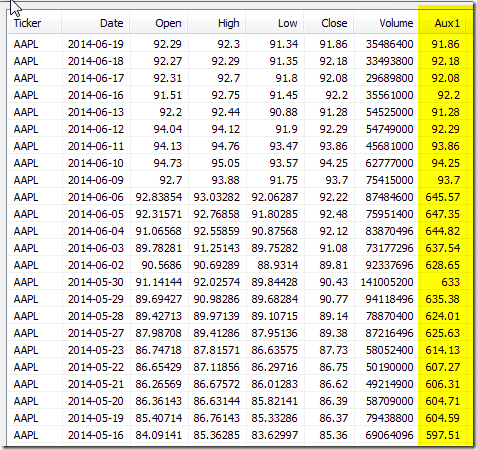
To achieve that, first we need to create an input information for AmiBroker where it could read the trades from. A convenient way would be to use an input file in text format, which could store information about trades, including the type of transaction (buy or sell), dates and position sizes. A sample input file may look like this:

Symbol,Trade,Date,Price,Shares
AAME,Buy,2000-04-06,2.66,375.94
AAME,Buy,2000-04-10,2.66,378.922
AAPL,Buy,2000-04-27,31.23,32.0862
AAON,Buy,2000-04-06,3.19,313.48
ABAX,Buy,2000-04-26,7.67,132.101
AB,Buy,2000-04-25,20.23,50.0337
A,Buy,2000-04-27,84.66,11.8362
AAME,Buy,2000-05-10,2.6,373.627
ABCB,Buy,2000-05-11,6.08,159.406
A,Buy,2000-05-15,82.27,11.736
AAON,Buy,2000-05-18,3.84,246.242
AB,Buy,2000-05-15,20.84,46.3303
ABAX,Buy,2000-05-18,5.84,161.913
ABCB,Buy,2000-05-15,6.08,158.803
AAME,Buy,2000-05-19,2.6,363.763
AB,Buy,2000-06-05,22.78,43.3501
ABC,Buy,2000-05-18,4.49,210.595

We can read and backtest such input with the formula presented below. It is important to remember that this particular code can work with input files of identical format (columns in identical order, signals specified with exact Buy / Sell words, position sizes specified as shares). Changing the input format would also require to update the formula to match the input.

Path to the file is specified in the very first line (note that double backslashes need to be used).

The formula reads the file line by line, then on a bar with matching date/time it generates a new Buy or Sell signal that is then combined with existing signals (coming from other bars).

file "C:\\TEMP\\trades.csv"// change this to real location of your data file
dt DateTime();
//
// Initialize variables
Buy Sell possize 0
//
fh fopenfile"r" );
//
if( fh )
 {
     while( ! 
feoffh ) )
     {
         
line fgetsfh );
         
// get the ticker symbol from the file
         
sym StrExtractline);
         
// if ticker matches current symbol
         
if ( Name() == sym )
         {
             
// extract data from line of text
             
trade StrExtractline);
             
trade_datetime StrToDateTimeStrExtractline) );
             
price StrToNumStrExtractline) );
             
shares StrToNumStrExtractline) );
             
//
             
if ( trade == "Buy" )
             {
                 
newbuy dt == trade_datetime;
                 
Buy Buy OR newbuy// combine previous buy signals with new
                 
BuyPrice IIfnewbuypriceBuyPrice );
                 
possize IIfnewbuysharespossize );
             }
             
//
             
if ( trade == "Sell" )
             {
                 
newsell dt == trade_datetime;
                 
Sell Sell OR newsell// combine previous sell signals with new
                 
SellPrice IIfnewsellpriceSellPrice );
             }
         }
     }
     
//
     
fclosefh );
 }
 else
 {
     
Error"ERROR: file can not be open" );
 }
//
SetPositionSizepossizespsShares ); 


Third party software “black list”

$
0
0

From time to time users face bizarre problems that after hours/days of investigation turn to be caused by 3rd party softwares that modify normal operation of Windows OS and cause troubles. As most problems are caused by badly written antiviruses, we recommend using Microsoft Security Essentials that is known to be OS friendly, working fast and without issues.

Here is a list of 3rd party software that are known to cause problems:

1. Avast Antivirus – specifically it’s Autosandbox feature messes up with operating system and effectively disallows application to write data to the disk. Which means that any of your changes to the data, watch lists, drawings, etc, will not be saved unless you turn off Autosandbox or uninstall Avast. Avast has its “heuristics” all wrong. They use Autosandbox even on legitimate, Microsoft Authenticode digitally signed applications like AmiBroker. Solution: uninstall Avast and install Microsoft Security Essentials instead.

2. Comodo Internet security - the same story as above – their “Sandbox” is messing up with OS and blocks applications from vital activity such as saving files or accessing registry. Their “sandbox” causes files to be stored in wrong places and become inaccessible. Either turn off sandbox or uninstall Comodo and install Microsoft Security Essentials instead.

3. Webroot Secure Anywhere – again it messes up with operating system causing problems with Windows Clipboard, preventing Edit->Paste from working in many applications including the new AFL editor. The solution is to go to Webroot Identity Protection settings and turn OFF Identity Shield. The issue affects many applications and is described in detail on their forum:
https://community.webroot.com/t5/Webroot-SecureAnywhere-Complete/Copy-Paste-Stops-Working-in-some-applications/td-p/21588/page/4

4. AMD Catalyst Software Suite, Desktop Desktop Manager – it may cause problems with saving window positions because it has a feature called “Dialog repositioning” that moves windows by itself somewhere else. AMD of course knows better where you want to have your windows. Solution: disable “Dialog repositioning” as shown below or turn off “Desktop Manager” feature. You may also uncheck “Preserve application position and size” box because AmiBroker remembers positions of all its windows by itself and does not need AMD’s help.

catalyst

For the list of recommended hardware and software see: http://www.amibroker.com/kb/2011/10/25/recommended-hardwaresoftware-for-amibroker/

How to restore accidentially deleted price chart

$
0
0

When working with chart windows it sometimes may happen that we mistakenly close the chart we meant to keep displayed. Here are some suggestions showing how to quickly restore our working setup.

First situation happens when when we closed all chart windows and AmiBroker shows just an empty application window, what looks like this:

Empty chart space

In such situation the best way is to use File–>New–>Default Chart menu command, as a result will display a new chart window, which contains charts stored in default template.

Re-open default chart

Second situation is when we closed just the Price chart pane, so only indicators would remain in the chart window, looking like this:

No price pane

In order to bring the Price chart back, go to Charts window, unfold Basic Charts folder and double-click on Price (all in one) (if you want to get price chart with moving average and Bollinger bands overlays), or double-click Price (if you want to get price chart alone).

Insert price chart

It will be located at the bottom, below the other charts, but we can move it up to the top if we right-click on the chart, then choose Pane->Move Up from the context menu.

It is worth noting that AmiBroker allows to create multiple chart setups stored in Layouts, so if we have already created several layouts before, it is also possible to re-load one of the layouts from the Layouts window to restore the whole saved chart setup. This functionality is discussed in details in the following tutorial chapter: http://www.amibroker.com/guide/h_sheets.html

How to setup automatic periodic scans & explorations

$
0
0

One of the most powerful features of AmiBroker is the ability of screening even hundreds of symbols in real-time and monitor the occurrence of trading signals, chart patterns and other market conditions we are looking for. This can be done in Analysis module with Scan or Exploration features.

The main difference between Scan and Exploration is that Exploration allows to customize the output shown in Analysis window (this is explained in details in the following tutorial chapter: http://www.amibroker.com/guide/h_exploration.html), while Scan performs search for at least one of Buy, Sell, Short, Cover signals and displays predefined set of columns. Both these features allow for continuous screening of the database in real-time conditions.

The following procedure shows how to configure basic scan formula and generate alerts when conditions coded in the formula are met. We assume that AmiBroker is already configured to receive real-time data from one of realtime data vendors – the list of recommended datasources is available here: http://www.amibroker.com/guide/h_quotes.html

We need to do the following:
– open Formula Editor window with Analysis->Formula Editor command from the menu
– in the editor window enter or paste the code below

// example trading signals defined here
Buy CrossMACD(), Signal() );
Sell CrossSignal(), MACD() );
//
// additional part of the formula which generates audio alerts when condition is detected
AlertIFBuy"SOUND C:\Windows\Media\Ding.wav""Audio alert");
AlertIFSell"SOUND C:\Windows\Media\Ding.wav""Audio alert");

After entering the code use Tools->Send to Analysis as shown below:

Send to Analysis

Then in the Analysis window select Apply To: All Symbols, Range: 1 Recent bar, this defines which symbols are included in the screening and what time-range will be shown in the results list.

Range setting

To enable continuous screening, mark Auto-repeat (AR) Scan/Explore option and enter the repeat interval. The interval can be specified in minutes or seconds (for example entering 10s means 10-seconds, while 5m means 5-minutes). The below example uses 15-second repeat interval:

Auto-repeat setting

NOTE: If that is the very first screening after launching the database and it may require filling the historical quotes, then it is also required to mark Wait for Backfill (applies to data sources, which support this feature, see: http://www.amibroker.com/guide/h_rtsource.html for more details).

Now press Scan button to initiate the screening process:

Scan

The results window will show the hits and generated alerts will also be logged in Alert Output window and the scan will be automatically repeated every 15 seconds in search for new signals.

Scan

More information about generating and configuration formula-based alerts is presented in this tutorial: http://www.amibroker.com/guide/h_alerts.html

What are constants in AFL and how they work

$
0
0

The AFL language contains many pre-defined words like: shapeUpArrow, stopTypeTrailing, colorRed, styleThick, inDaily and many more. These are examples of constants. As written in AFL language specification (http://www.amibroker.com/guide/a_language.html): Constants are tokens representing fixed numeric or character values.

To better explain what this means, let us consider example of PI constant, which equals 3.14159265358979….. PI is the name of constant we use this name in mathematical equations, because it is easier and more practical to use than using the numerical value each time. Constants in AFL serve the same purpose, each of these words represents certain value properly interpreted by the program in the context they are used.

That is why using the following statement in backtesting code:

ApplyStopstopTypeTrailingstopModePercent10 );

is much better to use than cryptic statement like:

ApplyStop2110 );

Both commands are equivalent, because value of stopTypeTrailing constant equals 2 and value of stopModePercent constant equals 1, yet the first version is much more understandable.

There is also another reason to use pre-defined constants rather than hard-coded numbers in the code. If for any reason the internal value of given constant changes due to development needs – all formulas using constants will continue to work properly (because new version would interpret them properly), while hard-coded numbers may change the code execution. For example – inWeekly and inMonthly constants have changed with introduction of N*inDaily timeframes, however if we always used:
TimeFrameSet( in Weekly ); in the code, then such internal change does not really affect our formulas at all.

There is one more example worth discussing – in the documentation of PlotShapes function we can find:

PlotClose"Price"colorBlackstyleCandle );
//
Buy CrossMACD(), Signal() );
Sell CrossSignal(), MACD() );
//
shape Buy shapeUpArrow Sell shapeDownArrow;
//
PlotShapesshapeIIfBuycolorGreencolorRed ), 0IIfBuyLowHigh ) );

So – what does the multiplication mean in the above context? If we remember that constants are in fact just numbers, and boolean True in AFL has numeric value of 1, while boolean False has numeric value of 0, then:

– if Buy is True (equals 1) and Sell is False (equals 0), then the result of such calculation will be

shape = 1 * shapeUpArrow + 0 * shapeDownArrow = shapeUpArrow

– if Buy is False (equals 0) and Sell is True (equals 1), then the result of such calculation will be:

shape = 0 * shapeUpArrow + 1 * shapeDownArrow = shapeDownArrow

The above approach is kind of shortcut that saves using conditional statements. It would work correctly only if Buy and Sell signals never occur on the same bar and only if we assign just 0 or 1 (False / True) to Buy and Sell arrays. Otherwise the result of calculations would be different. The internal value of shapeUpArrow is 1 and ShapeDownArrow is 2, so in situation, where both Buy and Sell signals were true, we would get

shape = 1 * shapeUpArrow + 1 * shapeDownArrow = shapeUpArrow + shapeDownArrow = 1 + 2 = 3

So – we would then pass number 3 to PlotShapes function and this is neither shapeUpArrow nor ShapeDownArrow, but a different shape. That is why in general case it is better to use conditional function IIf, like shown below:

shape IIfBuyshapeUpArrowIIfSellshapeDownArrowshapeNone ) ); 

This way we are always sure that returned value will be shapeUpArrow or shapeDownArrow or shapeNone.

Relationship between chart panes

$
0
0

In order to explain possible relationships between chart panes in AmiBroker, let us first introduce two important attributes associated with each chart pane, these are Chart ID and File path.

To see these attributes, we need to right-click on the chart and choose Parameters, then Axes&Grid tab:

Parameters window

The File path defines physical AFL file on your hard-drive that contains the indicator code used to generate charts. The Chart ID is an index to AmiBroker’s internal chart table. The chart table holds chart settings such as those seen in Axes&Grid tab, including the File path. So knowing the Chart ID, AmiBroker knows everything about the chart. The Chart ID uniquely identifies the chart.

Chart ID plays important role in the following areas:

  1. Chart parameters are keyed by Chart ID so two different charts may have same names of parameters, yet parameters are independent if those charts have different ChartID.
  2. Hand-drawn studies are stored wih Chart ID assigned to it, so they “belong” to given chart and can be referenced from other formulas using Study() function
  3. Chart IDs are stored in the layout files so AmiBroker knows which charts should be loaded when layout is loaded.

When we compare two charts, then the following relations are possible:

  1. if both Chart IDs and File paths are different, then charts are completely independent. This will happen if we use Insert option from the Charts window to create a new chart pane or when we double-click on the given formula (double-click works as Insert), because AmiBroker then would create new Chart ID and independent copy of the formula as described in manual http://www.amibroker.com/guide/h_dragdrop.html

    Insert

  2. if Chart IDs are different in both chart panes but File Path is the same, then these are different charts, yet they share same formula file. In such case hand-drawn studies will not get transferred and parameters will not be shared, but drag&drop operations and changes in the formula will affect both charts. This situation will occur if we use Insert Linked option from the Charts window to create a new chart pane directly linked to the original formula.

    Insert linked

  3. if Chart ID is the same for both – then it is essentially the very same chart. It means that all the hand-drawn studies and parameters are common for both charts (changes in one chart pane will affect the other) and all the drag&drop operations or formula changes affect both charts – that is because as a result of dragging and dropping indicators the underlying code is being modified (new sections are added). Such relationship between chart panes will happen when we open another chart window that uses the same chart template as the previous window (e.g. using File->New->Default Chart) or save chart template and load it from the other window.

There is also a functionality in AmiBroker, which allows to copy-paste the selected chart pane and define which elements are pasted. To do that click on the pane you want to copy, choose Edit->Copy from the menu, then switch to the place where you want to paste it and choose Edit->Paste Special

Paste Special

Choosing first option creates new Chart ID, and creates a copy of formula, so resulted chart is independent from source chart. Choosing second option creates new Chart ID, but links it to same formula as original, so the formula is shared. Choosing third option inserts a pane that uses same Chart ID (identical chart, everything shared).

Paste Special window

How to get support most efficiently

$
0
0

As a customer you want to have your questions and issues resolved most quickly and it is also our goal. In order to allow us to serve you the best possible answer in shortest possible time you need to provide some essential information that we can not collect without your help.

The most essential things you need to tell us when contacting support are:

  1. AmiBroker version you are running
  2. Data source you are using
  3. Exact error message you are getting, or screenshot if problem is of “visual” type
  4. The AFL formula that you are using (if question/issue is formula-related)

If we counted the hours wasted on e-mail exchange that was just asking for those details it would sum up to years. Please provide those in front. We really don’t know what you are running on your end.

There are countless examples when knowledge of these details would save hours of time (not only our but your time too). For example we write a formula for somebody, then he responds “it does not work” then we ask for details on what exactly does not not work and after some hours and e-mail exchanges it turns out that the customer is using old version of the software, while our formula used a function that was introduced lately.

When specifying AmiBroker version number please tell the number, not just “I am using latest version”, because latest means different thing for you and different for us. Your “latest” may mean latest official release and we may mean latest BETA that we just released a couple of minutes ago, so you are not even aware of it. So to remove doubt, please tell us exact number such as “I am running v5.85.0 32-bit”. You can find exact version number in the Help->About window.

Sometimes it also helps to know Windows version. For example we have seen cases when execution speed was different on XP and Windows 7 or when some feature did not work correctly on Windows XP because of Windows bug. So if you are reporting a problem/bug please include Windows version too. In this case you don’t need to tell us exact version, so “I am running Windows XP” or “Windows 7 64-bit” is perfectly fine.

Telling us a Data source is important when you are using plugin-driven data source. Pretty often 3rd party data sources that are plugin driven can cause bizzarre issues that can not be reproduced unless we know the data source.

It goes without saying that knowing the actual text of error message you get is essential for us. Please quote the message precisely as sometimes actual wording differs and there may be two similar messages yet they are different and resolution is also different. For any kind of “visual” problems it is best to send a screenshot. To make a screenshot, press PRINT SCREEN key on the keyboard (to make a short of entire screen), or ALT+PRTSCREEN (to make a screenshot of just active window). This puts a screenshot to the clipboard. Now you can paste it to MS Paint, MS Word, or any other graphic application. Some e-mail clients such as Thunderbird, allows pasting such image directly from clipboard into message (Edit->Paste, or Ctrl+V).

Sometimes it may not be obvious what is wrong on the screenshot so please describe what is wrong and/or annotate graphics. It helps tremendously.

As far as AFL-related problems are considered, knowing the formula is essential. If we can paste your formula to editor and reproduce reported behaviour on our end helping you becomes much easier and faster. An enormous amount of time could be gained if formula in question is sent to us. If for some reason you can not send us actual formula that you are using, please try to write a small one that just demonstrates the same problematic behavior. It is even better to have such minimalistic formula as it is quicker to find problem area in shorter one.

All of the above has one goal – enabling us to help you better and quicker. By following the guidelines above you will get your answers delivered faster and more efficiently. Thanks!

How to draw regression channel programatically

$
0
0

Built-in drawing tool allows to place regression channel on the chart manually and the study works on regular Close array as input. The power of AFL allows to automate this task and draw a customizable regression channel automatically in the chart or choose any custom array for calculation.

Here is a sample coding solution showing how to code Standard Deviation based channel. The Parameters dialog allows to control the array the channel is based upon, number of periods used for calculation, position and width of the channel.

lookback Param"Look back"201200);
shift Param"Shift"0020);
multiplier Param"Width"10.2550.25 );
color ParamColor"Color"colorRed );
style ParamStyle"Style"styleLine styleDots );
pricestyle ParamStyle"Price style"styleBar styleThickmaskPrice );
//
// price chart
PlotClose"Close"colorDefaultpricestyle );
//
array = ParamField"Price field", -);
//
BarIndex() + 1;
lastx LastValue) - shift;
//
// compute linear regression coefficients
aa LastValueRefLinRegIntercept( array, lookback ), -shift ) );
bb LastValueRefLinRegSlope( array, lookback ), -shift ) );
//
// the equation for straight line
Aa bb * ( - ( Lastx lookback ) );
//
width LastValueRefStDev( array, lookback ), -shift ) );
//
drawit > ( lastx lookback ) AND BarIndex() < Lastx;
//
// draw regression line...
PlotIIfdrawityNull ), "LinReg"colorstyle );
// ... and channel
PlotIIfdrawitwidth*multiplier Null ), "LinReg UP"colorstyle );
PlotIIfdrawitwidth*multiplier Null ), "LinReg DN"colorstyle );

Here is the picture that shows how it looks:

Regression in AFL


Position sizing based on risk

$
0
0

One of most popular position sizing techniques is Van Tharp risk-based method. Van Tharp defines risk as the maximum amount that can be lost in a trade. Typically you limit your loses by setting up a maximum loss stop.

The amount risked should not be confused with amount invested. If your stop is 15% away from entry price, in worst case you risk losing 15% of the position size (amount invested), not the entire amount. So risk practically means the amount of maximum loss stop.

Now, imagine that we only allow to lose 1% of entire portfolio equity in single trade. If our stop is placed 15% away, it means that to risk just 1% of entire equity we can put 1/15 part of our available equity into this trade. As we can see desired position size is inversely proportional to stop amount.

Buy CrossCMAC20 ) ); // some trading rules
Sell CrossMAC20 ), );
//
PositionRisk 1// how much (in percent of equity) we risk in single position
TradeRisk 15// trade risk in percent equals to max. loss percentage stop
PctSize 100 PositionRisk TradeRisk;
//
ApplyStopstopTypeLossstopModePercentTradeRiskTrue );
SetPositionSizePctSizespsPercentOfEquity );

Let us see how it works, say we have equity of $60,000, and we only want to risk 1% in single trade ($600). We set our protective stop to 15%. If stock entry price is say $20, we would put our protective stop at $20-15% = $17, so we will risk $3 per share. Given the fact that we want to risk only $600 in that trade, we could buy 200 shares (position risk 200 * $3 = $600). 200 shares @ $20 each gives position value of $4000. $4000 represents 6.667% of $60,000 and this is actual percentage position size we would open. As we can clearly see 6.667% is what we would get if we divide 1 (percent position risk) by 15 (percent loss amount): 1/15 = 6.667%

Instead of setting our stop as fixed percentage, we can use more sophisticated methods. For example we can adjust our maximum loss (so the risk) dynamically, using average true range, so it will get wider if stock is volatile and narrower if stock prices move in a narrow range. Say we want to set our stop to twice the amount of ATR( 20 ) at the entry bar and risk 3% of portfolio equity in a single trade:

Buy CrossCMAC20 ) ); // some trading rules
Sell CrossMAC20 ), );
//
RiskPerShare =  ATR20 );
ApplyStopstopTypeLossstopModePointRiskPerShareTrue );
//
// risk 3% of entire equity on single trade
PositionRisk 3;
//
// position size calculation
PctSize =  PositionRisk BuyPrice RiskPerShare;
SetPositionSizePctSizespsPercentOfEquity );

This time our maximum loss (so the risk per share) is expressed in dollars not in percents. Let us verify the above calculation. Assume that our equity is $90,000, stock price is $18, ATR(20) is $1. Now risk per share (the stop amount) equals 2 * $1 = $2, so our calculated position size (required % of equity) from the above formula would be:

PctSize = 3 * $18 / $2 = 27%

27% of $90,000 means trade size of $24,300, i.e. 1350 shares (@ $18 each). Since we risk $2 on each share, the total risk is $2 * 1350 shares = $2700, which is exactly 3% of our total equity ($90,000 * 3%).

In case of futures, we would need to take into account the fact that our position size depends on Margin Deposit, while the stop size (expressed in dollars) depends on the Point Value, so the position sizing formula would need to be modified.

Buy CrossCMAC20 ) ); // some trading rules
Sell CrossMAC20 ), );
//
RiskPerContract ATR20 );
ApplyStopstopTypeLossstopModePointRiskPerContractTrue );
//
// risk 1% of entire equity on single trade
PositionRisk 1
PctSize =  PositionRisk MarginDeposit  / ( RiskPerContract PointValue ); 
SetPositionSizePctSizespsPercentOfEquity );

Let us assume that we are trading a contract with $5000 margin deposit, point value $50, our equity is 1 million and ATR(20) is equal 5 big points. Risk per contract is then 10 big points. Now the above formula would give us:

PctSize = 1% * $5000 / ( 10 * $50 ) = 10%

10% of our 1 million equity is $100K, which allows us to buy 20 contracts (20 * $5000 each). Since our risk is 10 big points and each big point has a value of $50 we are risking 10 * $50 = $500 per contract. We have 20 contracts so entire position represents a risk 20 * $500 = $10,000 which is 1% of our 1 million equity.

Per-symbol profit/loss in a portfolio backtest

$
0
0

Backtesting engine in AmiBroker allows to add custom metrics to the report, both in the summary report and in the trade list. This is possible with Custom Backtester Interface, which allows to modify the execution of portfolio-level phase of the test and (among many other features) adjust report generation.

The example presented below shows how to retrieve individual profit/loss figures for each traded symbol in a portfolio test and add the results as custom metrics to the report. The code performs backtest, then iterates through the list of trades and stores each symbol profit in separate variables. Variables are created with VarSet function, which allows to build variable names dynamically, based on the symbol name. There are 2 variables generated per symbol, one holding profit for long trades and one for short trades. In the last part the code reads the created variables and adds input into the backtest report.

function ProcessTradetrade )
{
  global 
tradedSymbols;
  
symbol trade.Symbol;
  
//
  
if( ! StrFindtradedSymbols"," symbol "," ) )
  {
    
tradedSymbols += symbol ",";
  }
  
//
  // HINT: you may replace it with GetPercentProfit if you wish
  
profit trade.GetProfit(); 
  
//
  
if( trade.IsLong() )
  {
      
varname "long_" symbol;
      
VarSetvarnameNzVarGetvarname ) ) + profit );
  }
  else
  {
      
varname "short_" symbol;
      
VarSetvarnameNzVarGetvarname ) ) + profit );
  }

//  
SetCustomBacktestProc"" );
//
/* Now custom-backtest procedure follows */
//
if ( Status"action" ) == actionPortfolio )
{
    
bo GetBacktesterObject();
    
//
    
bo.Backtest(); // run default backtest procedure
    //
    
tradedSymbols ",";
    
//
    //iterate through closed trades
    
for ( trade bo.GetFirstTrade( ); tradetrade bo.GetNextTrade( ) )
    {
        
ProcessTradetrade );
    }
    
//
    //iterate through open positions
    
for ( trade bo.GetFirstOpenPos( ); tradetrade bo.GetNextOpenPos( ) )
    {
        
ProcessTradetrade );
    }
    
//
    //iterate through the list of traded symbols and generate custom metrics
    
for ( 1; ( sym StrExtracttradedSymbols) ) != ""i++ )
    {
        
longprofit VarGet"long_" sym );
        
shortprofit VarGet"short_" sym );
        
allprofit Nzlongprofit ) + Nzshortprofit );
        
// metric uses 2 decimal points and
        // 3 (calculate sum) as a "combine method" for walk forward out-of-sample
        
bo.AddCustomMetric"Profit for " symallprofitlongprofitshortprofit2);
    }
}
//
SetOption"MaxOpenPositions"10 );
//
Buy CrossMACD(), Signal() );
Sell CrossSignal(), MACD() );
Short Sell;
Cover Buy;
SetPositionSize10spsPercentOfEquity ) ; 

Once we run the Backtest, we will get the following output in the report, showing individual profit/loss figures for each symbol in test.

Per-symbol profit

If you prefer percent profits instead of dollar profits, just replace GetProfit() call with GetPercentProfit().

How to combine data from multiple input files

$
0
0

Sometimes it is useful to update existing database with quotes from other source and sometimes we just want to update one data field, leaving other unaffected. For example we may want to import data into Aux1 and Aux2 fields leaving regular OHLC prices untouched.

This post will show how to use $HYBRID mode of ASCII importer to combine data from multiple input files.

When we use Import Wizard / Import ASCII features to import quotations, by default the importer expects Close prices to be present in the imported data. There are some situations however when it would be convenient to import data just to one field (e.g. Aux1) if we have some additional values that we want to store in the database.

Of course, one way would be to combine all these quotes in a single file before the import and process in one run – but ASCII importer allows also to use special $HYBRID mode to import such partial data.

As an example, let us consider a situation where we already have adjusted OHLC quotes imported into the database and we have a file containing unadjusted quotes in the following format:

Ticker,Date,Aux1
AAPL,13-10-2014,99.81
AAPL,10-10-2014,100.73
AAPL,09-10-2014,101.02
AAPL,08-10-2014,100.80
AAPL,07-10-2014,98.75
AAPL,06-10-2014,99.62
AAPL,03-10-2014,99.62
AAPL,02-10-2014,99.90
AAPL,01-10-2014,99.18
AAPL,30-09-2014,100.75
AAPL,29-09-2014,100.11

In order to import those quotes into Aux1 field and combine with existing data, go to File->Import Wizard menu, pick the file and define format the following way:

ASCII import wizard

First we need to define columns so they match the format of input data (in this case set first three columns to Ticker, DMY, Aux1 and the rest to Skip).

To activate special hybrid mode we need to type:

$HYBRID 1

into Additional Commands box and since we are not importing regular prices that include Close array, we also need to mark Allow negative prices.

If instead of using the wizard we create import definition file manually, then it should contain:

$HYBRID 1
$ALLOWNEG 1

Now we can verify the results in Symbol->Quote Editor. The OHLC fields still contain adjusted values, while additional data has been properly stored in Aux1 field without affecting the other fields.

Quote Editor

For more information about Import Wizard and ASCII importer please check the following parts of the User’s Guide:
http://www.amibroker.com/guide/w_impwizard.html
http://www.amibroker.com/guide/d_ascii.html

Using price levels with ApplyStop function

$
0
0

ApplyStop function by default requires us to provide stop amount (expressed in either dollar or percentage distance from entry price). Therefore, if we want to place stop at certain price level, then we need to calculate the corresponding stop amount in our code.

This example shows how to place stops at previous bar Low (for long trades) and previous bar High (for short trades).

Stop amount parameter is simply the distance between entry price and desired trigger price (exit point). For long trade it is entry price minus stop level, while for short trade it is trigger (exit) price minus entry price. Additionally we may check if calculated distance is at least 1-tick large. We can distinguish between long and short entry by checking if one of entry signals is present (if a Buy signal is active then it is long entry, otherwise short). We only need to take care about the fact that if we are using trade delays we need to get delayed Buy signal as shown in the code below:

TradeDelay = -1// set it to 0 for no delays
//
SetTradeDelaysTradeDelayTradeDelayTradeDelayTradeDelay );
TickSize 0.01;
//
// sample entry rules
Buy CrossMACD(), Signal() );
Short CrossSignal(), MACD() );
Sell Cover 0// no other exit conditions, just stops
//
BuyPrice SellPrice ShortPrice CoverPrice Close;
//
// define stop level
stopLevelLong RefL, -); // use previous bar low
stopLevelShort RefH, -); // use previous bar high
//
// calculate stop amount
stopAmountLong BuyPrice stopLevelLong;
stopAmountShort stopLevelShort ShortPrice;
//
// make sure stop-amount is at least one tick
stopAmountLong MaxTickSizeBuyPrice stopLevelLong );
stopAmountShort MaxTickSizestopLevelShort ShortPrice );
//
// assign stop amount conditionally by checking if there is a Buy signal on given bar
IsLong RefBuy, -TradeDelay );
stopAmount IIfIsLongstopAmountLongstopAmountShort );
ApplyStopstopTypeLossstopModePointstopAmountTrue );

How to customize list-view columns

$
0
0

A list-view is a view that displays a list of scrollable items in a table-like format. List-views are used in Real-Time quote window, Analysis window, Symbol list, etc. The columns in any list-view in AmiBroker can be customized in various ways to better match our needs and display the required statistics and readings the way we find it most useful. For the sake of example let us consider Analysis window result list.

Many of the customization actions can be performed directly on the column headers. It is possible to re-order the columns by dragging them with mouse cursor:

Column drag

and their width can be re-sized by dragging the divider lines between columns (double-clicking on that area will auto-resize the columns to match their contents).

Column resize

Hint: You can auto-resize all columns to their content at once by holding down Ctrl key and pressing + (plus sign) key on the numeric keypad.

For more operations it is possible to use Setup Columns… menu available from the context menu, which displays after right-clicking on the headers.

Column resize

Setup Columns dialog allows to re-order, hide/show selected columns.

Column setup

To hide a column uncheck the box, to show it back again, check the box. To re-arrange columns, select a column and click Move Up/Move Down buttons.

It is important to remember that the set of columns will depend on the last run mode, so it will be different for Scan, for the Backtest Trade List, for Summary type of report or Optimization.

Column setup 2

Further customization options are available programmatically. Custom Backtest interface allows to add your own metrics to the backtest report (more info: http://www.amibroker.com/guide/a_custommetrics.html)

We can also define in our code where those additional columns are positioned in the report (this includes both custom metrics added to the report or optimized parameter values in the Optimization). By default they would be listed at the very end, but SetOption() function allows to set different position, for example:

SetOption("ExtraColumnsLocation");

Time compression of data retrieved from another symbol

$
0
0

AmiBroker’s Time-Frame functions (http://www.amibroker.com/guide/h_timeframe.html) allow to use multiple intervals within a single formula and combine them together. Another set of functions in AFL (Foreign and SetForeign) allow us to retrieve data of another symbol from the database, so we can implement strategies where rules are based on multiple symbols.

This article shows how to combine these two features together and properly use Time-Frame functions on data retrieved from another symbol. Let us consider an example of a strategy, which works on daily data, but uses an additional filter based on weekly readings of S&P500 index.

The following sequence is required to code such conditions properly:

  1. switch to the other symbol with SetForeign
  2. compress data into higher interval with TimeFrameSet
  3. store the weekly values / conditions in custom variables
  4. with TimeFrameRestore() or RestorePriceArrays() functions restore the original arrays of the tested symbol (in the original time-frame)
  5. use custom variables assigned in step (3) expanded to original time-frame using TimeFrameExpand()

Here is the AFL formula, which implements the above conditions:

// first switch to ^GSPC symbol
SetForeign"^GSPC" );
//
// compress data to weekly interval
TimeFrameSetinWeekly );
//
// assign weekly values to custom variables
indexWeeklyClose Close;
indexWeeklyMA =  MAClose52 );
indexWeeklyFilter Close MAClose52 );
//
// restore original arrays (back to the primary symbol)
// RestorePriceArrays() function is an equivalent
TimeFrameRestore();
//
// align data back to original interval
indexFilterExpanded TimeFrameExpandindexWeeklyFilterinWeekly );
//
// exploration shows the results, note that all weekly values
// need to be expanded if we haven't done it yet
//
Filter 1;
AddColumnClose"Close AAPL" );
AddColumnTimeFrameExpandindexWeeklyCloseinWeekly ), "Weekly close ^GSPC" );
AddColumnTimeFrameExpandindexWeeklyMAinWeekly ), "Weekly MA ^GSPC" );
AddColumnindexFilterExpanded"Weekly index filter");

Let us compare the readings obtained from the code with a sample chart – both ^GSPC raw reading and 52-week MA values match the chart and the condition is properly aligned to the bars starting on 2011-10-28 and extends until new weekly bar is formed.

TimeFrame + Foreign

There is also an alternative method we can use:

  1. retrieve values from ^GSPC using Foreign() function
  2. compress these readings into weekly interval using TimeFrameCompress
  3. perform calculations on weekly compressed array
  4. expand the compressed data back to the original timeframe using timeFrameExpand

indexClose Foreign("^GSPC","C");
indexWeeklyClose2 TimeFrameCompressindexCloseinWeekly );
indexWeeklyMA2 MAindexWeeklyClose252 );
indexWeeklyFilter2 indexWeeklyClose2 indexWeeklyMA2;
//
Filter 1;
AddColumnClose"Close AAPL" );
AddColumnTimeFrameExpandindexWeeklyClose2inWeekly ), "Weekly close ^GSPC" );
AddColumnTimeFrameExpandindexWeeklyMA2inWeekly ), "Weekly MA ^GSPC" );
AddColumnTimeFrameExpandindexWeeklyFilter2inWeekly ), "Weekly index filter");

How to export chart image to a file

$
0
0

Charts can be exported as GIF or PNG files either manually or programmatically.

To export chart image manually, simply use Edit->Image->Export to file menu. Instead of exporting you can also copy the image to Windows clipboard (Edit->Image->Copy As Bitmap – this will copy bitmap image or Edit->Image->Copy As Metafile – this will copy vector/scalable graphic).

In order to export image in programmatic manner (from external program), you can use OLE automation interface described here http://www.amibroker.com/guide/objects.html

Below is a sample JScript code that shows how to use OLE interface from the script:

AB = new ActiveXObject("Broker.Application");
AW AB.ActiveWindow;
AW.ExportImage"C:\\example.gif"640480 ); // 640, 480 are pixel dimensions

The code is intended to be used from the outside of AmiBroker.

To use above code follow these steps:

  1. Open Notepad
  2. Copy-paste above the code
  3. Save the file with .JS extension (which means that system will treat this as JScript code)
  4. Make sure that AmiBroker is running with desired chart as active one
  5. Double click on .JS file to execute the JScript code

After doing so, resulting example.gif image file can be found on C: drive.

OLE automation can also be used from any other COM/OLE-aware programs/languages.


How to force Line chart style for specific symbols (like mutual funds)

$
0
0

There is an easy way to avoid switching the price chart style back and forth if we want e.g. to display a candlestick chart for our stock symbols, but a line chart for just a subset of tickers in our database (e.g. mutual funds).

To achieve that – we need to set Continuous Quotations option to No in Symbol->Information window for the symbols that have only one price fixing per day (only close price available).

Continuous Quotations

Then – if we choose View->Price Chart Style to Auto – the chart will automatically use Line style for all symbols that have Continuous quotations option set to No. Other symbols will still use Candlesticks chart style.

Automatic style

How to exclude top ranked symbol(s) in rotational backtest

$
0
0

Rotational trading is based on scoring and ranking of multiple symbols based on user-defined criteria. For each symbol a user-definable “score” is assigned on bar by bar basis. Then, each bar, symbols are sorted according to that score and N top ranked symbols are bought, while existing positions that don’t appear in top N rank are closed.

Sometimes however, we may want to exclude the highest ranking symbol (or a couple of them) from trading. The code below shows how to do that using custom backtester.

ExcludeTopN 1// how many top positions to exclude
SetCustomBacktestProc("");

if ( Status"action" ) == actionPortfolio )
{
    bo GetBacktesterObject();
    bo.PreProcess();

    for ( bar 0bar BarCountbar++ )
    {
        Cnt 0;
        for ( sig bo.GetFirstSignalbar ); sigsig bo.GetNextSignalbar ) )
        {
            if ( Cnt ExcludeTopN )
                sig.Price = -1// exclude

            Cnt++;
        }

        bo.ProcessTradeSignalsbar );
    }

    bo.PostProcess();
}

EnableRotationalTradingTrue );

SetOption"MaxOpenPositions");
SetOption"WorstRankHeld"10 );
SetPositionSize20spsPercentOfEquity );
PositionScore RSI14 );

The code is pretty straightforward mid-level custom backtest loop but it uses one trick – setting signal price to -1 tells AmiBroker to exclude given signal from further processing. Note also that signals retrieved by GetFirstSignal / GetNextSignal are already sorted, so the highest ranked signal appears first in the list.

How to use Google to search AmiBroker site

$
0
0

Everyone knows how to use Google, but not everyone knows about a simple trick that tells Google to look for results only in single web site. To do so simply add +site:domain.com to your Google search string. To search just AmiBroker web site use +site:amibroker.com, for example to look for “Expectancy” you can just open Google page and type:

Google search

and you will see many results, all coming just from amibroker.com site:

Google search

This method works for any site, so if you want to search for something on Yahoo Groups use +site:groups.yahoo.com

How to correct forward looking timestamps

$
0
0

Some platforms, like Tradestation, use “future looking” timestamps in their data so for example 5 minute bars covering market activity from 9:30:00 till 9:34:59 are stamped with 9:35:00 (future time – see Tradestation manual explaining their timestamps.

AmiBroker, on the other hand, uses and expects natural timestamping, in which data from 9:30 are marked with 9:30 timestamp, so data from 9:30:00 until 9.34:59 belong to 9:30 5-minute bar.

In order to import data using future looking timestamps into AmiBroker you need to shift the timestamps by the amount equal to base data interval. In case of 5-minute bars, you need to shift data by -5 minutes.

To shift the data during import you can use $TIMESHIFT command of ASCII importer, see http://www.amibroker.com/guide/d_ascii.html

$TIMESHIFT hours

the hours parameter defines the time in hours that should be added to imported timestamps. You can use negative and fractional values too. Each minute is 1/60 of hour so shifting back by 1-minute would be -0.01666667.

If you are using ASCII Importer Wizard, and want to import 5-minute data with future looking timestamps, you can simply type the following in the “Additional commands” box of ASCII Importer Wizard.

$TIMESHIFT -0.08333333333333

where -0.08333333 is a result of dividing 5 by 60 (number of minutes in an hour)

Failure to shift the timestamps from future-looking back to natural format will result in higher time-frame charts (like hourly) being incorrect.

How to backup AmIBroker configuration

$
0
0

By default AmiBroker stores all its files and databases inside AmiBroker installation folder. Standard AmiBroker installation path is:
C:\Program Files\AmiBroker (32-bit program installed on 32-bit Windows or 64-bit program installed on 64-bit Windows)
or
C:\Program Files (x86)\AmiBroker (32-bit program installed in 64-bit Windows)

The best way to secure our setup is to make a copy of the entire AmiBroker folder with all its subfolders. No special tools are required for this operation – the entire directory can be copied into new location using Windows Explorer.

That allows to quickly restore the entire working setup if anything goes wrong just by copying the whole contents of AmiBroker folder back.

We need to remember that if we store our databases in locations outside AmiBroker folder, then we would need to backup the database folders as well. The same applies when we use custom location for Formula tree root path defined in Tools->Preferences->AFL. If the formulas are stored outside AmiBroker folder, then they would need to be copied as well.

For the purpose of handing individual elements of the configuration – the list of AmiBroker important files is available in the manual:
http://www.amibroker.com/guide/x_files.html

In particular, in order to backup / restore layouts we need to copy the entire Formulas folder, broker.newcharts file and the layout files you have in the other machine. This is because layouts refer to certain charts recognized by their chart ID number. So – all elements have to be present:
.awl files (holding layouts calling certain charts recognized by their ID)
broker.newcharts file which contains list of charts (their IDs) and their corresponding formula files
– contents of Formulas folder – to have formula referenced by certain charts

It is also good idea to have a backup of your entire disk. Such disk-imaging programs allow to restore entire computer setup in a matter of minutes without need to re-install Windows and all the programs. Two popular disk imaging programs are: Macrium Reflect or Acronis True Image and they allow backups to be done even while you are working.

For advanced users:

Certain settings and customizations of user interface are stored in the system registry. AmiBroker uses keys under:

HKEY_CURRENT_USER\Software\TJP\Broker\

Using Regedit tool allows to backup and restore registry keys too. To export AmiBroker registry key follow these steps:

  1. Click Start, type regedit.exe in the search box, and then press Enter
  2. Find HKEY_CURRENT_USER\Software\TJP\Broker\
  3. Right-click on the selected key and choose EXPORT from the context menu and save the file.

The following Microsoft KB article explains the procedure:
http://support2.microsoft.com/kb/322756

Viewing all 115 articles
Browse latest View live