When we double-click on the selected indicator in Charts window to display it in a new chart pane or apply our custom code as indicator, by default most of the indicator formulas will not show the date-axis, unless we specified such requirement in our formula.
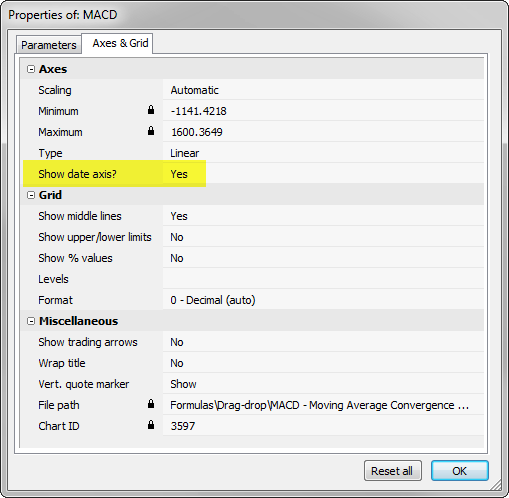
In order to display the date axis, we need to click on the chart with the right mouse button, choose Parameters->Axes&Grid tab, then set Show date axis option to YES.
There is also a way to pre-code such condition in our custom indicator formula. To enable data-axis display when we apply the new indicator formula, we just need to add relevant SetChartOptions() function call:
SetChartOptions( 0, chartShowDates );

// sample custom indicator
Plot( RSI(), "RSI", colorRed );
More information about SetChartOptions function can be found in the AFL reference:
http://www.amibroker.com/f?SetChartOptions